**This is an old revision of the document!**
PlayGround
Test stuff here.
1. Introduction
1.1 Presentation
This project was developed through an international collaboration between six students representing diverse European academic backgrounds. By integrating technical engineering with creative design, the project seeks to bridge the gap between digital arts and human interaction. As detailed in Table 1, this multidisciplinary approach is foundational to ensuring the resulting solution is sustainable, inclusive, and optimized for public engagement.
| Name | Studies | Location |
|---|---|---|
| Anna Bentzen | Applied Computer Technology | Norway |
| Giulia Vaneeckhout | Product Development | Belgium |
| Julian Bednarek | Computer Science | Poland |
| Leon Gunsilius | Interactive Media | Germany |
| Paula Macias | Industrial Organization Engineering | Spain |
| Rui Mendes | System's Engineering | Portugal |
1.2 Motivation
The selection of digital art as the project’s primary theme resulted from an evaluation of various sectors, including healthcare and general well-being. While these initial areas were considered, digital art was ultimately identified as the optimal intersection for the group's diverse expertise. This theme provided a unique synergy between the creative methodologies of the design-oriented members and the technical competencies of the computer science enthusiasts. By leveraging the convergence of artistic expression and digital innovation, the project transitioned from a theoretical concept to the development of an interactive installation designed to foster meaningful public engagement.
1.3 Problem
Although modern public transit systems (particularly metropolitan rail networks) are characterized by high physical density, they frequently function as spaces of significant social isolation. This phenomenon of collective detachment is driven by two primary factors:
Passive Digital Consumption: Passengers often utilize mobile devices as a primary strategy to mitigate the environmental stressors of crowded transit. This reliance on personal screens facilitates a transition from a shared public journey into a repetitive, solitary experience, a process often described as “digital escapism”.
The Anonymity of the “Non-Place”: Following Marc Augé’s theory of “Non-Places” , the metro is frequently perceived as a purely functional void, a transitional space to be endured rather than experienced. Current transit architectures lack the sensory stimuli required to encourage environmental presence or spontaneous interpersonal interaction. Consequently, these environments represent missed opportunities for community engagement and the promotion of collective mental well-being [1].
This project addresses the deficit of meaningful physical engagement by proposing an immersive, shared environment that challenges the habitual over-reliance on personal technology.
1.4 Objectives
The primary objective of this project is to redefine the metropolitan transit environment by transitioning it from a purely functional corridor into a participatory space. To achieve this, the project focuses on the following four goals:
Mitigate Digital Isolation: To provide tangible, real-world stimuli that incentivize passengers to decrease reliance on mobile devices during transit.
Humanize the Transit Environment: To transform passive, anonymous commutes into human-centered experiences through the integration of interactive sensory design.
Facilitate Collective Agency: To utilize synchronized light and sharing of life lessons via anonymous messages to demonstrate how individual physical presence contributes to a larger, collaborative environmental state.
Promote Environmental Presence: To encourage mindfulness and spatial awareness, ensuring that the commute results in a unique user narrative rather than a standard, repetitive transit cycle.
1.5 Requirements
To ensure compliance with European industrial standards and safety protocols, the project must adhere to the following regulatory framework:
1.5.1 Regulatory and Standard Requirements
The system shall be designed and documented in accordance with the following European Union (EU) Directives:
- Electromagnetic Compatibility Directive (2014/30/EU): Ensuring the system does not interfere with metro signaling or communication.
- Low Voltage Directive (2014/35/EU): Governing electrical safety for components operating within specific voltage ranges.
- Machinery Directive (2006/42/EC): Applied to the mechanical integration of interactive handrails.
- Radio Equipment Directive (2014/53/EU): For any wireless data transmission components.
- RoHS Directive (2011/65/EU): Restricting the use of hazardous substances in electronic hardware.
- Technical Standards: Mandatory use of the International System of Units (SI) and a preference for open-source software architectures to ensure transparency and scalability.
1.5.2 Functional and Experiential Requirements
- Universal Accessibility: The interface shall require no prior instruction or specific language proficiency, ensuring inclusivity for all demographic groups.
- Interpersonal Connectivity: The system must utilize shared sensory feedback to actively mitigate digital isolation and promote social interaction among passengers.
- Asynchronous Narrative (Digital Storytelling): The installation shall include a Quick Response (QR)-based platform near exit points to facilitate the possibility for users to send and read messages anonymously, creating a temporal link between passengers.
- Environmental Sustainability: Material selection and power consumption must prioritize ecological impact and long-term durability in high-traffic environments.
1.5.3 Technical and Hardware Requirements
- System Architecture: The hardware stack shall consist of a centralized power supply, a microcontroller unit (MCU), distributed input sensors, and synchronized output modules.
- Sensor Integration: The system shall utilize tactile inputs (pressure, heart rate) integrated directly into the metro’s physical infrastructure.
- Real-time Feedback: Visual (Light-Emitting Diode (LED)) and auditory (sound) outputs must respond with sub-perceptual latency to user interaction.
- Structural Integration: Existing metro handrails shall be replaced or modified with translucent housings containing embedded sensor-LED arrays.
- Visual Logic: The system must support multi-user light propagation, where individual touchpoints generate unique color pulses that travel vertically and blend on the ceiling to represent collective interaction.
1.6 Tests
The goal of this project is to create a working prototype of a Distributed Smart Lighting System for public transportation. This system enhances the passenger experience by providing interactive visual feedback through addressable LEDs, triggered by touch-sensitive poles equipped with Velostat sensors. By utilizing a Controller Area Network (CAN) Bus network, the system ensures high-reliability communication across the metro car, even in environments with high electromagnetic interference (EMI).
The primary objective of this project is to deliver a functional and robust prototype. To guarantee its performance and safety in a railway-simulated environment, several tests must be conducted. Each test is outlined below, including the specific Evaluation Methodology used to verify the results.
Functionality Tests:
(FT-01) Velostat Touch Detection: Connect the sensor node to a PC and monitor the Analog-to-Digital Converter (ADC) output via the Serial Plotter. Apply varying hand pressures to ensure the signal changes linearly and triggers the intended software threshold.
(FT-02) CAN Bus Communication: Implement a packet-counter script where the Pole Node sends 1000 sequential messages. The Ceiling Node will log received IDs to calculate the Packet Delivery Ratio (PDR), with a target of > 99.9 %.
(FT-03) LED Visual Response: Trigger the sensor and visually inspect the LED strip for color accuracy (Red, Green, Blue (RGB) values), ensuring no “dead pixels” or flickering occur during the animation cycle.
(FT-04) Sensitivity Calibration: Manually rotate the onboard potentiometer while applying a constant light touch. The test is successful if the trigger threshold can be adjusted to ignore vibrations while still detecting a deliberate touch.
(FT-05) Power Management: Use a high-voltage laboratory power supply set to 72 V and 110 V Direct Current (DC). Use a multimeter to verify that the Buck Converter output remains at a stable 5.0 V (± 0.1 V) under full LED load.
Performance Tests:
(PT-01) System Response Time: Record the interaction using a high-speed camera (240 Frames Per Second (FPS)). Count the frames between the initial hand-to-sensor contact and the first LED illumination to calculate total latency (Target: < 100 ms).
(PT-02) EMI Noise Resistance: Operate a brushed DC motor (simulating metro traction noise) within 10 cm of the CAN wiring and Velostat sensor. Monitor the system for “ghost triggers” or communication resets.
(PT-03) Thermal Performance Methodology: Activate the LEDs at 80 % brightness for 4 h in a non-ventilated environment. Use an infrared thermometer to measure the enclosure surface temperature every 30 min (Target: < 50 °C).
(PT-04) Voltage Drop Methodology: With the strip at full white brightness, measure the voltage at the Voltage at the Common Collector (VCC) pin of the very last LED using a multimeter. Ensure it remains above 4.7 V to prevent color distortion.
(PT-05) Long-term Durability: Use an automated mechanical actuator (or repeated manual cycles) to trigger the sensor 1000 times. Inspect the Velostat “sandwich” for delamination or loss of electrical sensitivity.
Software & Simulation Tests:
(ST-01) Components Integration Simulation: Import 3D models of the Printed Circuit Boards (PCBs) and converters into a Computer-Aided Design (CAD) environment (e.g., Fusion 360). Check for mechanical interferences and ensure a minimum 5 mm clearance between high-voltage and low-voltage traces.
(ST-02) CAN Bus Logic Simulation: Use a network simulator or a dual-MCU breadboard setup to force “data collisions” by sending messages from two nodes simultaneously. Verify that hardware arbitration correctly prioritizes the higher-priority ID.
(ST-03) Animation Algorithm: Run the LED code in a simulator (e.g., Wokwi) for 24 h to check for memory leaks or buffer overflows that could lead to software hanging.
(ST-04) Fault Detection: Physically disconnect the CAN High (CANH) wire during operation. The software must detect a “Heartbeat Timeout” within 500 ms and switch the LEDs to a static “Safety White” mode.
Safety Tests:
(SF-01) Electrical Safety: Perform a continuity test between the aluminum enclosure and the system Ground (GND) using a multimeter. Resistance must be < 0.1 Ω to ensure proper earthing.
(SF-02) Mechanical Safety: Conduct a tactile sweep test. Run a gloved hand over all surfaces and seams of the enclosure to ensure no sharp edges or protruding screws are present.
(SF-03) Fire Safety: Review the manufacturer datasheets for all cables and 3D filaments used. Verify they carry a V-0 (UL94) flammability rating or Low Smoke Halogen Free (LSHF) certification.
(SF-04) Vandalism Resistance: Attempt to peel the sensor off the pole using fingers. Apply a 5 kg impact to the sensor area and verify that the electrical housing remains intact and functional.
(SF-05) Ingress Protection (IP): Lightly spray the enclosure with a fine mist of water (simulating cleaning fluids). Open the box after 5 min to inspect for any moisture ingress near the electronic components.
User Acceptance Testing (UAT):
(UAT-01) Trigger Intuitiveness: Observe 5 non-technical users. Ask them to “activate the interaction” without explaining where the sensor is. More than > 80 % of users need to identify the pole sensor as the interaction point within 5 s.
(UAT-02) Visual Comfort (Glare Test): Users sit in a “metro seat” 1 m away from the LEDs. Cycle through all colors at max brightness. Users report no eye strain or “dazzle” effect (blinding light).
(UAT-03) Feedback Clarity: Ask users what the light animations signify (e.g., “What does the pulsing blue mean to you?”). Users correctly associate the animation with “System Active” or “Input Received”.
(UAT-04) Ergonomics (Touch Height/Force): Test with users of different heights and hand strengths. All users can comfortably trigger the system regardless of their physical stature.
The testing framework defined in this chapter ensures the transition of the System from a concept to a robust prototype. By addressing EMI, thermal management, and passenger safety, these protocols guarantee that the CAN Bus architecture and Velostat sensing are reliable, scalable, and ready for real-world deployment in public transportation.
1.7 Report Structure
Below we can find in Table 2 the main structure of the report and a short description of every chapter.
| Chapter | Title | Description |
|---|---|---|
| 1 | Introduction | A comprehensive look at the team’s vision, the core problem we are solving, and the specific technical goals and success criteria for this iteration. |
| 2 | Background and Related Work | An evaluative review of current market solutions, identifying gaps in existing research and how our approach differentiates itself. |
| 3 | Project management | A breakdown of the operational framework, including the selected development methodology, team roles, and resource allocation. |
| 4 | Marketing plan | A targeted plan for market positioning and user engagement, derived from an updated analysis of current industry trends. |
| 5 | Eco-efficiency measures for sustainability | Strategies for reducing the project's ecological footprint and an evaluation of the solution’s long-term environmental viability. |
| 6 | Ethical and Deontological concerns | A critical examination of the ethical dimensions of our work, focusing on societal impact and deontological standards. |
| 7 | Project Development | An in-depth technical walkthrough of the prototype’s architecture, hardware/software components, and the integration process. |
| 8 | Conclusions | A final assessment of the project’s outcomes against our initial goals, including a roadmap for future iterations. |
| 9 | Bibliography | A curated list of academic, technical, and industry sources that informed the project’s development. |
1.8 Summary
Chapter 1 has shown us what CONNECT and share is about. The places where people wait are not really places where people connect with each other. We want to make sure that people can have a shared experience with eachother when they are using the Porto Metro.
We are going to use technology to create digital art to make this happen.
Now that we knonw what we want to do with CONNECT and share we need to look at similar projects and products that already exist offers. The next chapter will provide background research for the loneliness issue, similar projects and research about the planned components for the final product. We will look at what already exists and what we can learn from it to make CONNECT and share.
2. Background and Related Work
2.1 Introduction
This chapter presents the background research done to develop CONNECT and share. It covers:
- Interactive urban light installations: Public art installations that respond to human presence in real time, where strangers collectively shape a shared visual environment through light and colour.
- Community stories: Projects that use everyday technology to connect strangers in a shared space through participation and co-creation.
- Participatory public art: Research into design principles that create a sense of connection between strangers in shared spaces.
- Research: Academic studies and technical documentation covering loneliness in urban environments, velostat as a pressure-sensing material, the ESP32 microcontroller family, CAN bus communication and addressable LED components.
- Comparative analysis: A structured overview of the products, installations, and sources reviewed in this chapter, summarising their relevance to CONNECT and share.
2.2 Products
2.2.1 Interactive urban light installations
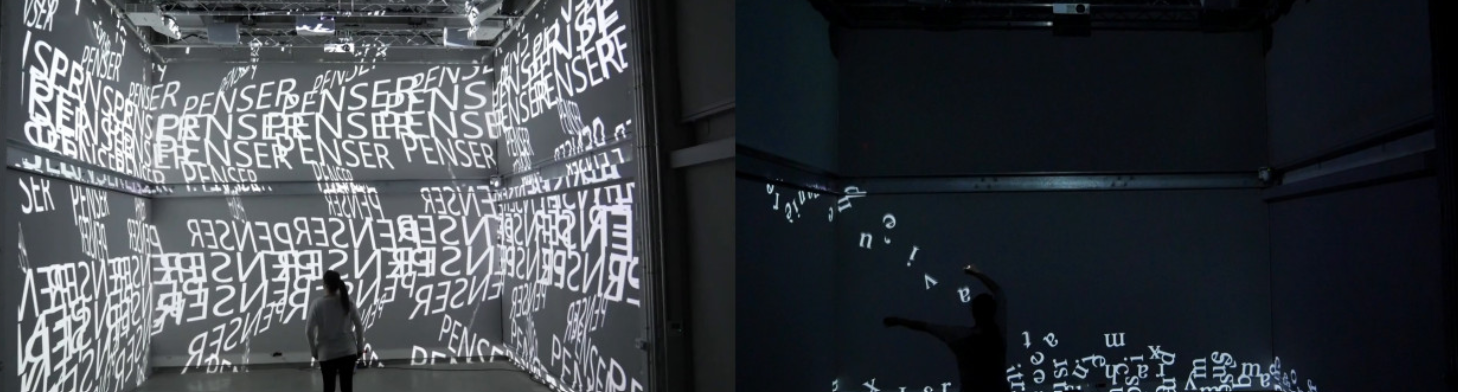
Kinetic particles is an interactive art installation that connects human physical movement with digital projections [2]. By using cameras and deep learning technology, the system tracks the body movements of performers and audience members in real-time, as illustrated in Figure 1. This tracking data is then used to control words and letters that are projected onto the walls of the room. When people move, their gestures (like the speed of their wrists) act like a force that pushes the projected text around, turning the words into moving particles. The project is designed to be an immersive experience where multiple people can explore the connection between their physical actions and the digital environment, allowing them to collaborate and interact with each other. This article is highly relevant to our research because both projects use technology to create a shared, physical experience rather than isolating people. In the “Kinetic particles” installation, multiple spectators can simultaneously interact with an immersive digital environment. The authors note that this collective setup invites people to collaborate and synchronize their movements. This directly connects to our idea of blending passengers' light colors in the metro. Additionally, the project demonstrates that giving intuitive, real-time visual feedback based on physical actions creates a lively and organic interaction. We can use these findings as proof that interactive design can effectively pull people out of their digital bubbles and connect them with strangers.
2.2.2 Community stories
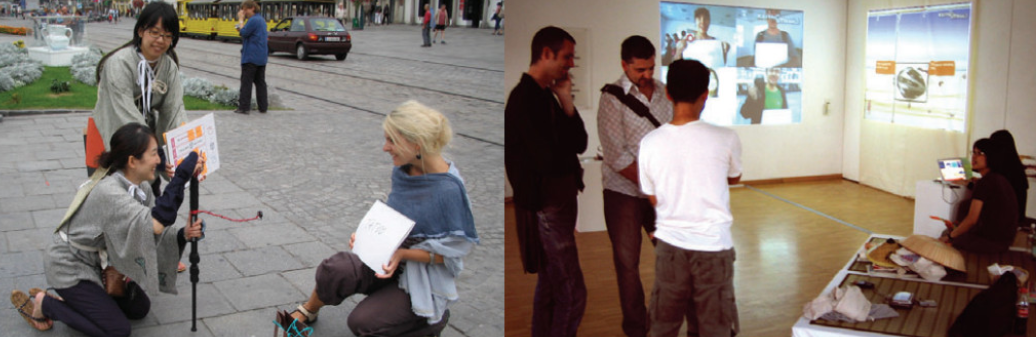
This article describes the project Keitai Trail in which researchers used mobile phones to collect and link personal stories from people in public spaces [4]. During an art festival, the researchers made a workshop, seen in Figure 2. Here participants recorded short videos based on a specific question-and-answer game. Each person answered a question from a previous participant, shared a short story, and then posed a new question for the next participant. All these connected stories were then projected onto a large screen so that participants could view the entire network of videos. The aim was to change users' mindsets by using everyday mobile phones as creative means of expression rather than just for one-way communication [5].
This research is relevant to our project because it demonstrates how technology can be used to collect stories from strangers and connect them in a shared environment. Similar to our concept with QR codes and anonymous messages in the underground, this project utilise an everyday device to lower the threshold for participation and capture human experiences in an “expression mode”. The authors show that providing a clear structure, such as answering a question from a predecessor, acts as an incentive to help people share their thoughts. Furthermore, making these connections visible helps participants understand that their own story has an impact on the bigger picture and that they are part of the world around them. We can use this insight to substantiate that our installation and web application featuring messages will indeed offer travelers a sense of community and connection.
2.2.3 Participatory Public Art
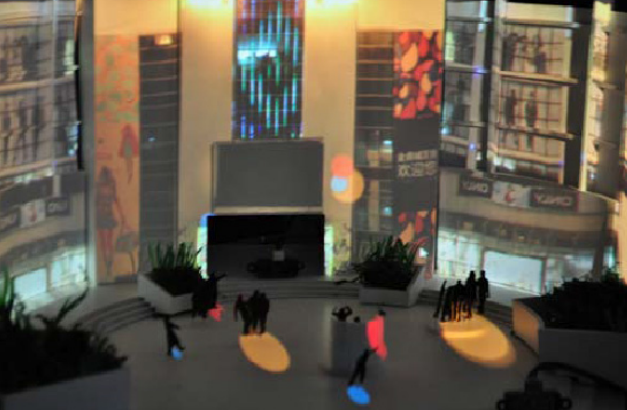
This article outlines the evolution of materials used in public art and how new technologies have led to interactive and participatory installations [7]. The authors categorize art forms into static, dynamic, interactive, and participatory levels. In participatory forms, artists do not just create a final object; they design a platform that grows through the creative input of the public. The paper highlights several design cases to illustrate this concept. One example is “Strijp-T-ogether”, an installation designed for a creative industrial area. It uses a mobile app where users can draw or add graphics to a photo of the main hall. These additions are then projected into the physical space and appear on other users' phones, encouraging people to react to each other's drawings and stimulating social interaction among individuals from different companies (see Figure 3). Another example, “Leave Your Mark”, uses projection mapping and a live camera feed to connect two different locations in a city, allowing a person walking by to see a stranger “drawing” on the installation elsewhere, aiming to increase feelings of inclusion and connectedness. This article is relevant to CONNECT and share because it provides a theoretical framework for participatory public art. The examples demonstrate that combining a physical environment with a digital, co-creative layer can foster social interaction between strangers in a shared space. This supports the argument that CONNECT and share's approach, where passengers collectively shape a visual environment through touch follows an established design principle for creating a sense of shared presence.
While these installations demonstrate how interactive systems can foster shared experiences, they rely on large-scale sensing technologies such as cameras and projection systems. In contrast, CONNECT and share translates these principles into a distributed embedded system suitable for a metro environment, using touch-based sensing, microcontrollers, and LED feedback.
2.3 Research
2.3.1 Loneliness in public spaces
A central motivation behind CONNECT and share is the observation that people in dense urban environments such as metro carriages, often feel more disconnected from those around them, not less. This paradox is supported by the research article “Lonely in a crowd” [9], who investigated the real-time relationship between loneliness and the social environment, published in Scientific Reports. Using a smartphone-based assessment method, 756 participants across multiple countries reported their momentary feelings of loneliness up to three times daily over 14 days, alongside observations about their immediate environment [10].
The study found that perceived overcrowding was positively associated with loneliness (OR: 1.39), meaning that being surrounded by many people did not reduce feelings of isolation, it increased them. In contrast, perceived social inclusivity, defined as feeling welcome, feeling that others would help you, and sensing shared values with those nearby, was significantly associated with lower loneliness (OR: 0.79). Contact with nature similarly reduced loneliness (OR: 0.72), and the two effects amplified each other when combined [11].
The findings from this study highlights the problem we want to solve with our project. They suggest that placing people in proximity to one another is not enough to create a sense of belonging, what matters is whether people feel acknowledged and included by those around them [12]. We aspire to address this by creating a shared experience that makes the presence of fellow passengers visible and meaningful, without requiring explicit social interaction. Rather than demanding conversation or eye contact, it uses light as a medium to signal to passengers that they are part of a collective moment.
It should be noted that the study has limitations. The sample was self-selected and the main participants was educated, middle-aged, Caucasian participants, which limits how broadly the findings can be generalized. Loneliness was also measured with a single survey item, and the study is observational, meaning the associations found do not establish causation. Still, the core finding, that overcrowding increases loneliness while perceived inclusivity reduces it, provides a meaningful theoretical basis for our project.
Despite these limitations, the finding by Hammoud et al. that perceived overcrowding increases loneliness (OR: 1.39) while inclusivity reduces it (OR: 0.79) directly shaped CONNECT and share’s output design. We operationalized this by projecting color across the shared ceiling rather than limiting feedback to a single pole, ensuring each passenger's presence is visible to the entire carriage.
2.3.2 Microcontroller
The decision to use a microcontroller from the ESP32 family is supported by a comparative analysis of microcontroller platforms for the Internet of Things (IoT) and embedded systems [13]. The study evaluates the ESP32 against comparable boards and concludes that its combination of low cost, low power consumption, and compatibility with the Arduino development environment makes it well suited for sensor-driven embedded applications.
In CONNECT and share, the system is distributed across two types of nodes: sensor nodes embedded in each handrail pole, and a central ceiling node that drives the LED strip. Each node handles one task: either reading pressure input from the velostat sensor, or sending colour signals to the LED strip. A single-core microcontroller is sufficient for this, as no parallel processing is required at the node level. The ESP32 microcontroller can handle multiple tasks simultaneously [14], which is not necessary for our project. Therefore we use the WEMOS mini, a development board based on the ESP32-C3 is used for this. It is a single-core RISC-V variant in the ESP32 family. This was chosen due to its compact form factor and lower power consumption compared to the dual-core original [15].
The Arduino-compatible development environment shared across the ESP32 family is a practical advantage for our multidisciplinary student team, as it is «beginner-friendly» and have several libraries for both sensor input and LED control [16].
Maier et al. confirmed that the ESP32-C3 offers sufficient processing capacity for single-task embedded nodes at low power. In CONNECT and share, each Sensor Node performs only ADC polling and CAN transmission, while the Central Node only processes incoming CAN frames and drives LED output. No parallel processing is required at either node, making the single-core WEMOS C3 Mini the appropriate and cost-effective choice.
2.3.3 Velostat sheet
The decision to use velostat sheets for touch detection in the handrails of CONNECT and share is grounded in established research on flexible piezoresistive materials. Velostat is a polyethylene-carbon composite material that changes its electrical resistance in response to applied pressure. When compressed, the resistance decreases, producing a measurable electrical signal [17] Dzedzickis et al. evaluated the mechanical and electrical characteristics of velostat as a tactile sensor material, testing it under static, long-term, and cyclic load conditions.
The results confirm that velostat produces consistent, repeatable signals across multiple loading cycles, and that it can be implemented using a simple electrode pair [18]. These properties make it well suited for CONNECT and share, where the sensor must reliably detect the pressure of a passenger gripping a handrail and produce a signal the ESP32 can read.
A practical advantage of velostat for this application is its flexibility. The material is thin and can conform to curved surfaces such as a handrail without requiring rigid mounting. One limitation noted in the research is that velostat's response is not perfectly linear and may drift slightly under repeated use [19]. To account for this, the sensor node includes a 10 kΩ potentiometer that allows the sensitivity to be manually adjusted during prototyping until reliable detection is achieved.
Velostat is not perfectly linear and its sensitivity shifts with repeated use, as Dzedzickis et al. documented under cyclic loading conditions. The Sensor Node PCB addresses this directly: a 10 kΩ potentiometer on the board lets the sensitivity threshold be tuned physically during installation, without touching the firmware, which matters when grip pressure varies significantly between passengers.
2.3.4 CAN Bus and MCP2551 transceiver
CONNECT and share uses a distributed node architecture: each handrail pole contains an independent sensor node, and a central node at the ceiling receives their signals and controls the LED strip. Coordinating these nodes requires a communication protocol that can handle multiple transmitters on a shared line and remain reliable in an electrically noisy environment.
CAN (Controller Area Network) is a serial communication protocol originally developed for automotive applications, where multiple electronic control units must communicate reliably despite high levels of electrical interference [20]. It is standardised under ISO 11898 and is widely used in embedded systems beyond the automotive industry, including industrial and building automation contexts [21]. Of particular relevance to Connect is CAN’s use of differential signalling: the bus carries each signal across two lines with opposite voltages, so interference affects both lines equally and is cancelled out at the receiver [22]. This makes CAN significantly more robust against electromagnetic noise than single-ended alternatives, which is important in the context of a metro carriage.
The MCP2551 is a high-speed CAN transceiver developed by Microchip Technology that implements the physical layer of the ISO 11898 standard [23]. It acts as the interface between the microcontroller's digital Transmit (TX) / Receive (RX) pins and the differential CAN bus line. One unit is placed at each node both the sensor nodes in the poles and the central ceiling node.
A metro carriage is electrically hostile. Traction motors and power converters produce continuous EMI that would corrupt single-ended protocols like Inter-Integrated Circuit (I2C) or Universal Asynchronous Receiver-Transmitter (UART). Bozdal et al. document exactly this weakness in non-differential bus architectures, which is why Connect uses CAN throughout.
2.3.5 WS2812B addressable LED strip
The WS2812B is an individually addressable RGB LED component that integrates the control circuit and the RGB emitter into a single 5050-format package [24]. Each unit contains a built-in driver IC that receives colour data, applies it to its own output, and passes the remaining data to the next unit in the chain via a single data line. This daisy-chain architecture means the entire ceiling strip can be controlled from one digital output pin on the microcontroller [25].
Individual addressability is essential for CONNECT and share's core interaction: each passenger's contact with a handrail must produce a distinct colour that travels visibly up the pole and merges with others across the ceiling. The WS2812B supports 256 brightness levels per colour channel, giving a total of approximately 16.7 million possible colours [26].
The strip is compatible with the FastLED library available in the Arduino development environment, which is consistent with the microcontroller platform used across the rest of the system.
CONNECT and share consists of multiple distributed sensor nodes embedded in handrails, each detecting passenger interaction through velostat sensors. These nodes communicate via a CAN bus network to a central controller located in the ceiling, which drives an addressable LED strip to visualise collective interaction.
The component review above evaluated the WS2812B. During implementation, the project adopted the WS2813, an enhanced variant that adds a redundant backup data line, so a single failed LED does not interrupt the rest of the strip. All subsequent hardware, power, and prototype sections refer to this part.
2.4 Comparative analysis
The sources reviewed in this chapter fall into two groups: installations and products that are relevant to the design of Connect, and research or technical literature that informs the component choices. These are summarised in table 3 and table 4.
The three installations in 3 each highlight something relevant to Connect. Kinetic Particles shows that giving people real-time visual feedback based on their physical actions can pull them into a shared experience. Keitai Trail shows that people are more willing to participate when the interaction uses something familiar, like a phone. Strijp-T-ogether is the closest to what Connect is trying to do: it shows that adding a co-creative digital layer to a physical space can get strangers to interact in a meaningful way.
In 4, the study by Hammoud et al. is the main theoretical motivation for the project. It shows that being surrounded by people does not make you feel less lonely, what matters is whether you feel noticed and included. The other entries in the table are more technical. Maier et al. informed the choice of microcontroller platform, Dzedzickis et al. supports the use of velostat for detecting grip pressure, and Bozdal et al. explains why CAN bus is a good fit for a system that needs to stay reliable in an environment with a lot of electrical noise. The MCP2551 and WS2812B datasheets document the specific components used for the CAN bus connection and the LED output.
| Category | Technology/Medium | Interaction Type | Core Focus | Relevance to Connect |
|---|---|---|---|---|
| Kinetic Particles | Cameras, deep learning, digital projections | Real-time physical movement | Connecting physical movement with a digital environment | Proves that real-time visual feedback pulls people out of their digital bubbles |
| Keitai Trail | Mobile phones, large projection screens | Asynchronous (recording Q&A videos) | Collecting and linking personal stories | Supports the use of everyday devices to foster a sense of community |
| Participatory Installations (Strijp-T-ogether) | Mobile apps, projection mapping, live camera feeds | Real-time and asynchronous digital co-creation | Stimulating social interaction through a shared platform | Provides a theoretical framework for passengers co-creating their metro environment |
| Category | Method | Key Finding | Relevance to Connect |
|---|---|---|---|
| Hammoud et al. – Lonely in a Crowd | Smartphone-based ecological momentary assessment | Overcrowding increases loneliness; perceived inclusivity reduces it | Confirms the problem Connect aims to address |
| Maier et al. – ESP32 | Comparative analysis of microcontrollers for IoT | ESP32 family offers low cost, low power consumption, and Arduino compatibility for embedded applications | Justifies the choice of the WEMOS C3 mini for the sensor and ceiling nodes |
| Dzedzickis et al. – Velostat | Mechanical and electrical testing under static, long-term, and cyclic load conditions | Velostat produces consistent, repeatable signals and can be implemented with a simple electrode pair | Justifies the use of velostat sheets for pressure detection in the handrails |
| Bozdal et al. – CAN Bus | Survey of CAN protocol properties and security | CAN's differential signalling provides strong immunity to electrical noise and interference | Justifies the use of CAN bus for communication between nodes in a metro environment |
| Microchip Technology – MCP2551 | Component datasheet | Implements the ISO 11898 physical layer, acting as the interface between microcontroller and CAN bus | Justifies the choice of transceiver for each node in the system |
| WorldSemi – WS2812B | Component datasheet | Individually addressable RGB LED with integrated driver, controllable via a single data line | Justifies the choice of LED component for producing distinct, blendable colours on the ceiling |
2.5 Summary
This chapter has reviewed existing installations, research, and technical literature relevant to CONNECT and share. Kinetic Particles and Strijp-T-ogether demonstrate that physical interaction driving real-time visual feedback can create a genuine sense of shared presence between strangers, while Keitai Trail shows that lowering the participation threshold through familiar everyday actions produces stronger community engagement. Both observations informed the two-phase structure of CONNECT and share: immediate ambient light response in Phase 1, and the web application where passengers can send messages anonymously in Phase 2.
Hammoud et al. establish the social motivation: that one needs to feel engaged with people around you to reduce the feeling of loneliness. That finding provide more than context for CONNECT and share, it is the reason the light output targets the shared ceiling rather than the individual pole, and why the blending of multiple passengers' colors is the central mechanic rather than a secondary feature.
The technical decisions is backed by research. Velostat handles pressure detection in the handrails because it is flexible, consistent under cyclic load, and manageable despite its non-linearity through the on-board potentiometer. CAN handles inter-node communication because the metro's EMI environment makes single-ended protocols unreliable. The WEMOS C3 Mini handles local processing because the node tasks are simple enough that a single-core microcontroller is sufficient and lower power. The WS2812B handles ceiling output because individual addressability from one data line maps directly onto the distributed node architecture.
In the next chapter the team’s work regarding project management is accounted for.
3. Project Management
This chapter details the project management methodologies and organizational frameworks applied throughout the development of the project. It outlines the team's approach to structuring, executing, and monitoring the workload using an Agile framework organized into 15 distinct sprints.
It covers:
- Scope & Time Management: Definition of the product and project boundaries, alongside schedule management, key milestones, and visual timelines mapping project phases to deadlines.
- Cost & Quality: An overview of the budget allocation, financial tracking (planned versus effective costs), and the quality metrics and thresholds established to evaluate project deliverables.
- People, Stakeholders & Communications: Identification of team roles, responsibilities, stakeholder engagement strategies, and the internal communication channels that guided the group.
- Risk & Procurement: The identification, analysis (quantitative and qualitative), and mitigation of product and project-level risks, alongside sourcing strategies and make-versus-buy decisions.
- Project Plan: A structural breakdown of the project timeline, detailing the Global Sprint Plan, the comprehensive Project Backlog, and the distribution of Epics across the project lifecycle.
- Sprint Outcomes & Evaluations: A review of sprint backlogs, planned capacity versus achieved velocity, and summaries of sprint retrospectives that drove the team's continuous improvement strategy.
3.1. Scope
Defining the scope of CONNECT and share is essential for keeping our efforts focused on the project's objectives: reducing digital isolation and enhancing the passenger experience within the Metro do Porto. By mapping out exactly what is included in the project, we can prevent scope creep and ensure every team member understands the roadmap from conceptualization to final development.
The Work Breakdown Structure (WBS) seen in the Figure 4 ilustrates how we have divided the project into manageable phases and specific deliverables.

3.2. Time
The EPS teams have to complete a list of milestones to ensure project succes. The following Table 5 defines the project timeline, acting as the baseline to monitor the project's performance.
| Date | Description |
|---|---|
| 2026/02/28 | Choose and share the team's top 3 preferred project proposals |
| 2026/03/11 | Upload the “black box” System Diagrams & Structural Drafts |
| 2026/03/18 | Upload the List of Components and Materials (what & quantity) |
| 2026/03/21 | Define the Project Backlog, Global Sprint Plan, Initial Sprint Plan and Release Gantt Chart |
| 2026/03/25 | Upload System Schematics & Structural Drawings to the wiki (Deliverables) and do the cardboard scale model of the structure |
| 2026/04/12 | Upload the Interim Report and Presentation to the wiki (Deliverables) |
| 2026/04/16 | Interim Presentation, Discussion and Peer, Teacher and Supervisor feedbacks |
| 2026/04/22 | Upload 3D model video to Deliverables |
| 2026/04/29 | Upload the final List of Materials (local providers & price, including VAT and transportation) |
| 2026/05/02 | Upload refined Interim Report (based on Teacher & Supervisor Feedback) |
| 2026/05/13 | Upload packaging solution to Deliverables and Report |
| 2026/05/27 | Upload the results of the Functional Tests to the Report |
| 2026/06/13 | Upload the Final Report, Presentation, Video, Paper, Poster and Manual to Deliverables |
| 2026/06/18 | Final Presentation, Individual Discussion and Assessment |
| 2026/06/23 | Update the wiki, report, paper with all suggested corrections. Hand in to the EPS coordinator a printed copy of the poster, brochure and leaflet |
| 2026/06/25 | Demonstration of the operation of the prototype and hand in the prototype and user manual to the client |
The timeline reveals a strong concentration of deliverables in April and May, particularly around the interim report and prototype development phases. This required careful sprint planning to balance documentation and technical implementation tasks.
3.3. Cost
This section details both the anticipated and actual expenditures incurred during the development of the CONNECT and share prototype. Tracking financial performance against initial projections allows the team to detect inefficiencies early, justify spending decisions, and demonstrate fiscal responsibility within the constraints set by the project brief.
3.3.1. Ideal Product Cost
This section outlines the projected costs for a full-scale, production-ready deployment of CONNECT and share across a single metro carriage: 11 handrail nodes, 7 power supply units, and 3 ceiling LED strip runs.
Table 6 presents the planned ideal product hardware costs.
| Component | Type / Model | Qty | Unit Price (€) | Total (€) |
|---|---|---|---|---|
| Microcontroller | Wemos C3 mini (ESP32-C3) | 11 | 6.20 | 68.20 |
| Enclosure | PA Rail (fire-resistant, 3D printed) | 2 | 69.30 | 138.60 |
| Copper tape | Conductive adhesive, 20 mm × 20 m | 15 | 8.86 | 132.90 |
| Velostat | Piezoresistive sheet (pressure sensor) | 15 | 7.90 | 118.50 |
| CAN Transceiver | MCP2551-I/P | 10 | 1.99 | 19.90 |
| LED strip (addressable RGB) | WS2813 IP65, 60 LEDs/m, 1 m | 3 | 30.49 | 91.47 |
| Power supply | DC Step-Down 36–72 V to 12 V, 10 A, 120 W | 6 | 24.67 | 148.02 |
| Wiring, resistors | Miscellaneous passive components | 1 | 10.00 | 10.00 |
| Power supply | (5 V) | 1 | 37.15 | 37.15 |
| Delivery | — | — | — | TBC |
| Total | 764.74 |
Hardware costs per carriage total 764.74 €, with the Polyamide (PA) Rail enclosure being the single most expensive line item at 138.60 € for two units, specified due to its fire-resistance properties required for compliance with metro safety standards. No equivalent Portuguese-based supplier was identified at the time of writing, with the current source located in France. At scale, per-unit hardware costs could be reduced through bulk procurement across multiple carriage deployments.
3.3.2. Prototype Cost
All components were procured through a single supplier (Mauser) to consolidate shipping and avoid duplicate delivery charges. The 3D-printed PLA enclosure was produced using university fabrication facilities, so the line item covers filament material only. Measurement and testing instruments were obtained on loan from the university laboratory, with no associated purchase cost. Table 7 presents total list and pricing of components for the prototype. Planned cost is 2,63 € below budget ceiling (100 €).
| Component | Type / Model | Qty | Unit Price (€) | Total (€) |
|---|---|---|---|---|
| Microcontroller | Wemos C3 mini (ESP32-C3) | 2 | 6.20 | 12.40 |
| Enclosure | PLA biodegradable (3D printed) | 1 | 13.99 | 13.99 |
| CAN bus cable | 2×1.0mm CCA speaker wire, 10m | 1 | 2.20 | 2.20 |
| LED strip diffuser | Opaque sliding diffuser for aluminium profile, 2m | 1 | 3.27 | 3.27 |
| Potentiometer | 10 kΩ linear mono | 1 | 0.49 | 0.49 |
| Copper tape | Conductive adhesive, 50 mm × 20 m | 1 | 17.60 | 17.60 |
| Velostat | Piezoresistive sheet (pressure sensor) | 2 | 7.90 | 15.80 |
| CAN Transceiver | MCP2551-I/P | 2 | 1.99 | 3.98 |
| LED strip (addressable RGB) | WS2813 IP65, 60 LEDs/m, 2m | 1 | 11.27 | 11.27 |
| Barrel jack adapter | DC female 5.5×2.1mm screw terminal | 1 | 0.92 | 0.92 |
| Power supply | 5 VDC 4 A 20 W, 5.5×2.1mm | 1 | 11.75 | 11.75 |
| Jumper cables | 120-piece Dupont set M-M/M-F/F-F, 200mm | 1 | 3.20 | 3.20 |
| Resistors | Metal film 1 kΩ 0.6 W | 10 | 0.05 | 0.50 |
| Total | 97.37 |
3.4. Quality
Quality management is needed to ensure that every deliverable meets the technical requirements and the expectations of our primary stakeholders: Porto Metro passengers and EPS coordination. Following the Project Management Body of Knowledge (PMBOK) standards, quality is managed as a continuous process rather than a final check. By defining clear metrics and verification protocols, we minimize risks and guarantee that the final prototype is safe, functional and socially impactful.
3.4.1 Quality Requirements and Metrics
To quantify the success of our work, we have established specific metrics and acceptance thresholds. As seen in Table 8 each deliverable is associated with a measurable requirement. The selected quality metrics focus on three dimensions: technical functionality, user experience, and project completeness. This ensures that CONNECT and share is not only operational, but also meaningful and usable in its intended social context.
| WP | Deliverable (WBS) | Requirement | Quality Metric | Threshold (Acceptance) |
|---|---|---|---|---|
| 1. Management | 1.1 WBS | Organize tasks | Complete list of deliverables | All mandatory deliverables included |
| 1.2 Gantt Chart | Control deadlines | Approved schedule | Finalized timeline | |
| 1.3 Global Sprint Plan | Plan sprints | Sprint dates | Approved sprint plan | |
| 1.4 Weekly Sprint Plan | Weekly tracking | Weekly version | Updated weekly plan | |
| 1.5 Product Backlog | Distribute workload | Jira | All active sprint tasks assigned | |
| 1.6 Stakeholder Management | Identify key people | Stakeholder map | Closed list of stakeholders | |
| 1.7 Risk Managemet Plan | Prevent issues | Response plan | Critical risks under control | |
| 2. Research | 2.1 State of the Art | Learn from others | Market analysis | Similar solutions reviewed |
| 2.2 Ethics | Comply with the law | Ethics report | Standards met | |
| 2.3 Sustainability | Environmental care | Environmental report | Materials analyzed | |
| 3. Design | 3.1 Structural Drawings | Assembly clarity | Final version of drawings | Approved blueprints |
| 3.2 Black Box Diagram | Define connections | Block diagram | Error-free logic flow | |
| 3.3 Detailed Schematics | Circuit design | Electronic schematic | Finished and reviewed drawing | |
| 3.4 Prototype (CAD) | 3D Design | Final digital model | Components fit correctly | |
| 3.5 Packaging | Casing protection | Casing material | > 95% recyclable material | |
| 3.6 Cardboard Model | Physical 3D “twin” | Real-scale model | Design matches 3D model | |
| 4. Development | 4.1 List of Materials | Control spending | Final budget | Max. 100 € total cost |
| 4.2 Code | System programming | Correct operation | Code runs without error | |
| 4.3 Simulations | PC Testing | On-screen results | Approved simulation | |
| 4.4 QR APP | Create the link | QR Functionality | QR code works correctly | |
| 5. Marketing | 5.1 Flyer | Create brochure | Visual appeal | Professional, non-pixelated design |
| 5.2 Leaflet | Explain the project | Message clarity | Passengers understand it instantly | |
| 5.3 Poster | Design poster | Impact on the Metro | Visible colors and CONNECT and share logo | |
| 5.4 Marketing Video | Record promotion | Promo quality | Fluid image and engaging message | |
| 5.5 3D Model Video | Show the interior | Technical fidelity | Internal mechanism is clearly visible | |
| 6. Testing | 6.1 Functional Tests | Test operation | Test results | System is fully functional |
| 6.2 User Interaction | Test with people | User opinion | Positive user feedback | |
| 6.3 KPI Definition | Set goals | Success definition | Project targets fixed | |
| 6.4 Data Analysis | Analyze results | Data charts | Analyzed and clear data | |
| 7. Reporting | 7.1 Interim Report | Mid-term report | Wiki chapters | Approved draft |
| 7.2 Interim Pres. | Present progress | PowerPoint presentation | Presentation performed | |
| 7.3 Final Report | Final report | Final Wiki document | All required chapters finalized | |
| 7.4 Final Pres. | Final defense | Project defense | Final presentation performed | |
| 7.5 Paper | Write article | Paper format | Finished article | |
| 7.6 Manual | User guide | Instructions for use | Easy-to-follow guide |
To quantify the success of our work at the product level, we have established specific metrics and acceptance thresholds for the physical and digital architecture of CONNECT and share. As seen in Table 9, each technical subsystem and deliverable is associated with a measurable requirement. The selected quality metrics focus on three dimensions: hardware stability, network communication, and software performance. This ensures that the CONNECT and share prototype is not only operationally sound under railway simulation constraints but also structurally safe and robust for real-world user interaction.
| WP | Deliverable (WBS) | Requirement | Quality Metric | Threshold (Acceptance) |
|---|---|---|---|---|
| 3. Design | 3.1 Main Ceiling Housing | Anchoring and PCB protection | Geometric dimensional accuracy | Physical parts stay within ± 1 mm of CAD model |
| 3.2 Pole Secondary Node | Isolate internal components | Localized structural tension | Stress below 10% of yield strength under 100N load | |
| 3.3 Enclosure Materials | Comply with railway fire safety | Flammability certification | V-0 (UL94) / LSHF compliance under EN 45545-2 | |
| 4. Development | 4.1 Central Node PCB | Regulate node power supply | Voltage stability under full load | Output voltage stays at 5.0 V ± 0.1 V |
| 4.2 Sensor Node PCB | Condition Velostat input | Analog baseline voltage | Absolute 0 V baseline with stable 2.2 kΩ pull-down | |
| 4.3 LED Strip Array | Drive digital lighting array | Signal noise margin (VIH) | Amplitude ≥ 3.5 V to prevent data line flickering | |
| 4.4 CAN Bus Network | Broker distributed node data | Packet Delivery Ratio (PDR) | ≥ 99.9% frame delivery over 1000 messages | |
| 4.5 Interaction Firmware | Implement low-power states | Standby current consumption | Current draw dropped below < 15 mA in deep-sleep | |
| 4.6 QR Web Application | Scale message database | API route failure rate | 0.0% error rate under 1000 concurrent write requests | |
| 4.7 AI Moderation Layer | Filter toxic text entries | Content approval classification | 100% rejection of harmful or offensive strings | |
| 6. Testing | 6.1 System Response Time | Real-time ambient animation | Processing & propagation delay | Total latency from touch to light pulse < 100 ms |
| 6.2 Ergonomic Usability | Ensure universal accessibility | Interaction intuitive rate | ≥ 80% of users trigger the system in ≤ 5 seconds | |
| 6.3 System Usability Scale | Validate user experience (UX) | Standardized 10-item questionnaire | Mean SUS score higher than the industry average (> 68) |
3.4.2 Verification Sheets
While metrics define “what” we want to achieve, our verification system ensures “how” we check it. Table 10 presents a series of Yes/No questions for every deliverable. These sheets act as a final quality gate: if the answer to the question is “Yes”, the deliverable is accepted.
| WP | Deliverable (WBS) | Necessary Steps (Checklist) |
|---|---|---|
| 1. Management | 1.1 WBS | Map 100% of the 35 mandatory EPS deliverables inside the work breakdown hierarchy. |
| 1.2 Gantt Chart | Ensure the project baseline duration variance stays strictly below 5% on critical paths. | |
| 1.3 Global Sprint | Define and align 100% of the milestone timelines across the sprints. | |
| 1.4 Weekly Sprint | Update real task progress logs in Jira every Thursday. | |
| 1.5 Product Backlog | Verify that $\geq 95\%$ of all active Jira tasks have an owner and a Story Point estimate assigned before sprint activation. | |
| 1.6 Stakeholders | Complete the communication mapping matrix for 100% of the identified stakeholder groups. | |
| 1.7 Risk Mgmt | Allocate a dedicated mitigation or avoidance action plan for 100% of high-exposure risks (Score $\geq 60$). | |
| 2. Research | 2.1 State of Art | Complete a detailed competitive benchmarking study analyzing $\geq 3$ similar market solutions. |
| 2.2 Ethics | Enforce a zero-data collection architecture to ensure 100% GDPR compliance with 0 bytes of personal data stored. | |
| 2.3 Sustainability | Ensure $\geq 80\%$ of the structural deployment design specifies sustainable or circular materials (Cork / PA Rail). | |
| 3. Design | 3.1 Structural | Finalize CAD assembly drawings including complete physical measurement annotations and $\pm 1$ mm clearances. |
| 3.2 Black Box | Close 100% of data network signals, integrating hardware timeouts and error-handling loops for open nodes. | |
| 3.3 Schematics | Validate the design circuit with 0 short-circuit flags and maintain $\geq 5$ mm trace separation between voltage rails. | |
| 3.4 Prototype (CAD) | Run spatial interference check to verify 0 mm volumetric overlapping between embedded electronic PCBs and the enclosure. | |
| 3.5 Packaging | Construct a 100% monomaterial, 100% recyclable cork housing that can sustain a physical load $\geq 100$ kg. | |
| 3.6 Cardboard | Complete a 1:1 scale physical ergonomics mock-up and secure formal approval by a unanimous team review. | |
| 4. Development | 4.1 List Materials | Limit total prototype materials and shipping expenditure to stay strictly under the €100 project cap. |
| 4.2 Code | Log 0 memory leaks, stack overflows, or software lockups during a continuous 24-hour runtime simulation. | |
| 4.3 Simulations | Achieve a localized structural safety factor $> 2.0$ against the yield limit of the housing material under FEA load states. | |
| 4.4 QR APP | Validate that 100% of scanned quick response paths trigger immediate HTTP 200 routing to the production landing URL. | |
| 5. Marketing | 5.1 Flyer | Verify that all visual assets are exported with a professional graphic density of at least 300 DPI. |
| 5.2 Leaflet | Measure that non-technical testers can decode the core CONNECT and share value proposition within $< 10$ seconds. | |
| 5.3 Poster | Ensure the corporate CONNECT and share logo identity remains perfectly legible from a physical distance of at least 3 meters. | |
| 5.4 Marketing Video | Render a full high-definition video track (1080p @ 60fps) with audio levels normalized strictly to -14 LUFS. | |
| 5.5 3D Video | Display 100% of internal mechanism structures, including PCB positioning and internal CAN Bus network pathways. | |
| 6. Testing | 6.1 Functional | Measure a Packet Delivery Ratio (PDR) $> 99.9\%$ across the serial communication bus under 1000 iterative data frames. |
| 6.2 User Test | Achieve an excellent mean usability score $> 68$ using the standardized 10-item System Usability Scale (SUS) ($n = 11$). | |
| 6.3 KPI Def. | Quantify 100% of success metrics with distinct mathematical limits, eliminating descriptive, non-measurable targets. | |
| 6.4 Data Analysis | Plot 100% of test result graphs with explicit variance indicators, mean standard deviations, or error bars. | |
| 7. Reporting | 7.1 Interim Report | Deliver 100% of mid-term Wiki chapters completely filled with 0 empty pages before the academic deadline. |
| 7.2 Interim Pres. | Format the speech presentation structure to fit strictly within the 15-minute allocation window ($\pm 30$ seconds). | |
| 7.3 Final Report | Execute automated spell-check and peer review to ensure 0 linguistic errors and 100% compliance with standard SI formatting. | |
| 7.4 Final Pres. | Ensure 0 hardware resets, connection dropouts, or power failures occur during the live presentation demo. | |
| 7.5 Paper | Verify 100% structural layout compliance against the mandatory IEEE / academic conference publishing template. | |
| 7.6 Manual | Measure a success rate $> 90\%$ for independent, non-technical users attempting to operate the system using the step-by-step instructions. |
Similarly, to verify the physical and digital architecture of the product without repeating project management milestones, Table 11 provides the specific verification checklist for the technical deliverables of CONNECT and share. These product-level questions serve as the final engineering gate before hardware deployment.
| WP | Deliverable (WBS) | Necessary Steps (Checklist) |
|---|---|---|
| 3. Design | 3.1 Main Ceiling Housing | Do all physical fabrication dimensions of the printed enclosure stay within a ± 1 mm tolerance band when measured against the Fusion 360 CAD model? |
| 3.2 Pole Secondary Node | Does the localized structural tension remain below 10% of the material yield strength under a 100 N distributed load during SimScale FEA testing? | |
| 3.3 Enclosure Materials | Do the structural housing compounds and internal wire insulation layers carry official V-0 (UL94) flammability or LSHF certifications under standard EN 45545-2? | |
| 4. Development | 4.1 Central Node PCB | Does the output voltage of the central node power rail maintain a stable 5.0 V ± 0.1 V output under a continuous 100% white LED brightness load? |
| 4.2 Sensor Node PCB | Does the analog sensor conditioning circuit maintain an absolute 0.00 V baseline on the ESP32 ADC pin when the Velostat grip is completely idle? | |
| 4.3 LED Strip Array | Does the digital data line driven by the MCU reach a signal amplitude high enough (VIH ≥ 3.5 V) to completely eliminate high-frequency pixel flickering? | |
| 4.4 CAN Bus Network | Does the communication interface achieve a Packet Delivery Ratio (PDR) ≥ 99.9% when transmitting 1000 consecutive data frames under simulated engine EMI? | |
| 4.5 Interaction Firmware | Does the standby electrical current consumption of the distributed nodes drop below < 15 mA during interrupt-driven deep-sleep states? | |
| 4.6 QR Web Application | Does the production database API route achieve a 0.0% failure rate when subjected to a heavy load test of 1000 concurrent write operations? | |
| 4.7 AI Moderation Layer | Does the server backend automatically reject 100% of toxic, harmful, or offensive message strings with an immediate HTTP 400 bad request error? | |
| 6. Testing | 6.1 System Response Time | Is the total end-to-end delay between the physical touch contact and the visual LED trail ignition strictly under < 100 ms when analyzed at 240 FPS? |
| 6.2 Ergonomic Usability | Do ≥ 80% of non-technical sample passengers instinctively locate and successfully trigger the handrail interaction area in ≤ 5 seconds? | |
| 6.3 System Usability Scale | Does the final calculated mean score from the 10-item System Usability Scale (SUS) survey sit comfortably above the industry baseline (> 68)? |
3.5. People & Stakeholder Management
To make CONNECT and share and share a success, it is necessary to strategically manage all parties affected by the project. Following the PMBOK standards, this section identifies the key individuals and groups, defines their roles and outlines the management strategy.
3.5.1. Project Team and Internal Dynamics
We operate under a structure where all members share responsibility for project management. However, as we are a team of students with diverse backgrounds, special tasks are delegated based on individual expertise.
Using the weekly sprint plan helps us to redistribute tasks if a member is overburdened to prevent burnout and ensure quality.
3.5.2. Stakeholders Identification and Roles
Apart from the main teams, several external entities are involved in the project. In the Table 12 below, we identified them, their roles and their responsibilities.
| Entity / Name | Project Role | Primary Responsibility |
|---|---|---|
| Team Members | Project owners | Responsible for the full development cycle and all mandatory deliverables. |
| Coaches | EPS Supervisors | Supervise, evaluate progress, and provide strategic feedback. |
| ISEP Faculty | Advisors | Offer specialized knowledge in Electronics, Sustainability, Project Management, Ethics, Marketing, among others. |
| ISEP | Main sponsor | Provides infrastructure and funding for the components (BOM). |
| Metro do Porto | External client | Provides the operational context and establishes security and infrastructure standards. |
| Security Department (Metro) | Regulatory body | Validates that the handle complies with fire, electrical, and physical safety regulations. |
| Metro do Porto Users | Target group | Live the CONNECT and share experience during their commutes and provide feedback. |
| Suppliers | Suppliers | Responsible for the timely delivery of components. |
| Legal | Regulatory compliance | Guarantees that the QR app and data management comply with European regulations. |
| Maintenance Team (Metro) | Operational stakeholder | Evaluates ease of installation, durability, and maintenance of the smart handle. |
| Cleaning Staff (Metro) | Operational support | Provides hygiene, accessibility, and resistance of the materials. |
Among all stakeholders, Metro do Porto, the Security Department (Metro), and end users are considered critical, as they directly influence feasibility, approval, and user acceptance.
3.5.3. Stakeholders Management Strategy
To manage these relationships effectively, we have analyzed each stakeholder based on their Power and Interest. This analysis allows us to prioritize our communication and engagement efforts.
A) POWER/INTEREST MATRIX
The following matrix, seen in the Figure 5, categorizes our stakeholders into four quadrants to determine the necessary level of engagement for each group.

B) ENGAGEMENT STRATEGY TABLE
While the matrix identifies the “where”, the following Table 13 defines the “how”. It establishes the specific strategy for each group and assigns a point person from the internal team to manage the relationship.
| ID | Stakeholder Group | Quadrant | Management Strategy | Point Person |
|---|---|---|---|---|
| 1 | Team Members | Manage Closely | Daily collaboration, stand-up meetings, and shared decision-making | All Members |
| 2 | Metro do Porto | Manage Closely | Continuous alignment with their operational context and branding requirements | Management Lead |
| 3 | Security Department | Manage Closely | Strict adherence to fire and electrical safety rules to ensure final approval | Technical Lead |
| 4 | Maintenance Team | Keep Satisfied | Ensure the design is durable and provide a clear installation manual | Hardware Lead |
| 5 | Coaches | Keep Satisfied | Weekly progress reports, Wiki updates, and formal meetings | Management Lead |
| 6 | ISEP (Sponsor) | Keep Satisfied | Compliance with budget (BOM) and laboratory facility usage rules | Management Lead |
| 7 | Metro Users | Keep Informed | Gather feedback through surveys and haptic testing to improve the UX | Marketing Lead |
| 8 | ISEP Faculty | Keep Informed | Consulting on technical challenges (Electronics, CAD, and Marketing) | Technical Lead |
| 9 | Legal | Keep Informed | Ensure all digital interactions and data handling follow EU regulations | Legal Lead |
| 10 | Suppliers | Monitor | Tracking component availability and lead times for hardware integration | Hardware Lead |
| 11 | Cleaning Staff | Monitor | Selecting materials that resist the Metro's chemical cleaning protocols | Hardware Lead |
3.6. Communications
To ensure CONNECT and share's success, communication is key. A communication strategy has been established to guarantee alignment between team members, supervisors and stakeholders.
3.6.1. Communication Channels and Tools
The team uses multiple tools to maintain a continuous flow of information:
- WhatsApp: Used for urgent, informal and daily communication.
- Microsoft Teams: Serves as the primary repository for all project documentation. Also for remote meetings.
- Jira: Used to track the backlog, manage sprints and assign tasks to team members.
- Miro: A digital whiteboard used during brainstorming sessions.
- Outlook: Reserved for formal communication with external stakeholders, suppliers and ISEP coordinators.
3.6.2. Communication Matrix
Table 14 presents our activities and the way of realization, covering the frequency, medium, and participants involved in each communication event throughout the project.
| Activity | Objective | Frequency | Medium | Participants |
| Daily Stand-up | Daily tasks and identify blockers. | Daily | WhatsApp / Face-to-Face | Team Members |
| Weekly Meeting | Review weekly progress and plan next Sprint. | Every Thursday | Face-to-Face | Team & Supervisors |
| Sprint Planning | Define tasks and goals for the next cycle. | Weekly | Jira | Team Members |
| Retrospective | Evaluate team performance and workflow. | Weekly | Face-to-Face | Team Members |
| Interim Demo | Present project status to coordinators. | Milestone-based | Presentation | Team & Supervisors |
3.6.3. Stakeholder Management
We maintain a specific communication frequency with external parties:
- ISEP Supervisors: Weekly feedback sessions every Thursday to ensure the project meets academic requirements.
- Target Users: Feedback gathered through surveys and testing sessions.
3.7. Risk
Risk management for CONNECT and share involves a systematic approach to identify and address potential challenges. Following the PMBOK standards, we have performed qualitative analyses to ensure that risks are treated effectively.
3.7.1. Identification of Key Risks
We have identified the following risks categorized into project and product levels.
PROJECT LEVEL RISKS:
- Delivery: Delays in receiving components
- Financial Constraint: Exceeding the budget due to component value or price fluctuations
- Team Synchronicity: misalignment in tasks leading to delays in the final assembly
PRODUCT LEVEL RISKS:
- Safety Rejection: Failure to meet safety standards
- Vandalism: Intentional damage or theft of the internal electronics
- Environmental Durability: Material degradation
- Cybersecurity: QR code spoofing
- Power Supply Instability: Failure of the internal battery or power management system during long commutes
- Ergonomic Strain: The handle design causing discomfort or safety issues for passengers
- Privacy Breach: Unauthorized collection or exposure of user data through the interaction app.
3.7.2. Qualitative and Quantitative Evaluation
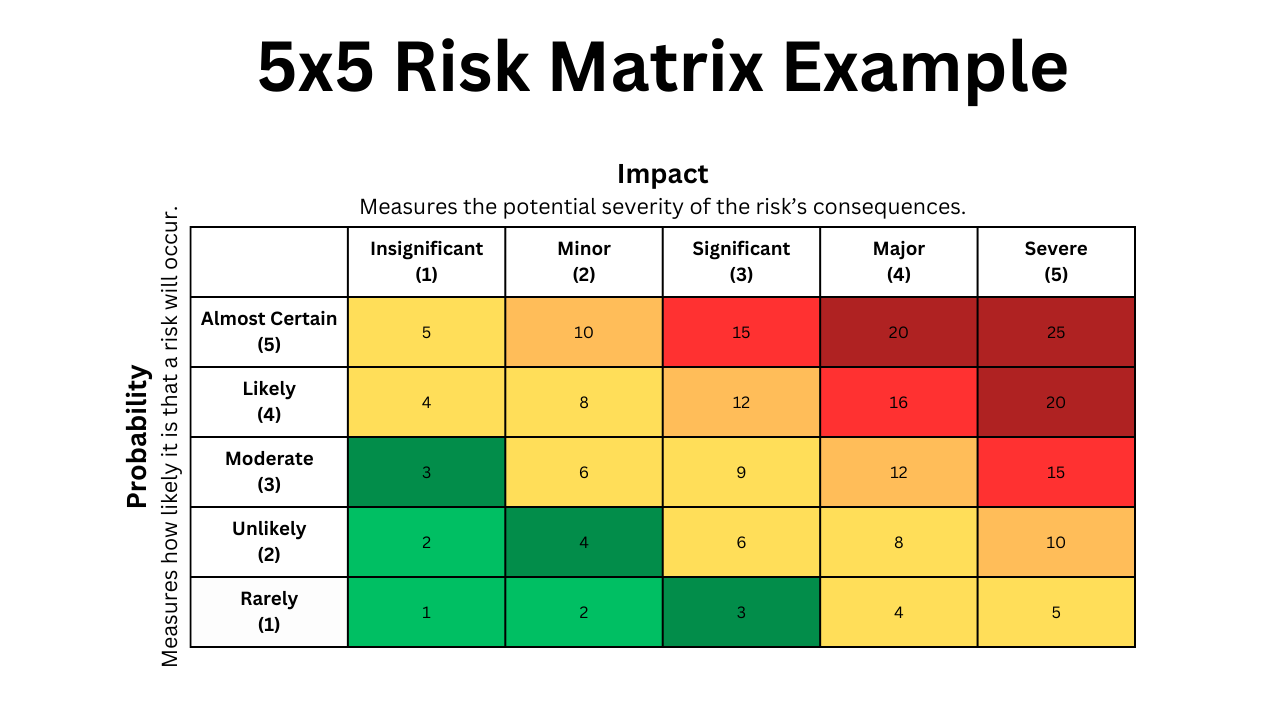
To evaluate these risks, we adopt a 5×5 Risk Matrix seen on the Figure 6. The exposure score is calculated by multiplying Probability (1-5) and Impact (1-5).
Probability Scale: 1 (Rare) to 5 (Almost Certain)
Impact Scale: 1 (Insignificant) to 5 (Severe)
EXPOSURE LEVELS:
- Low (1-3): Acceptable; minimal monitoring.
- Moderate (4-6): Manageable; requires routine control.
- High (8-12): Significant; requires a specific mitigation plan.
- Extreme (15-25): Critical; requires immediate action and response.
3.7.3. Risk Analysis, Handling, and Monitoring Table
The risk analysis highlights that logistical and physical risks (delivery and vandalism) pose the greatest threat to project success, like it is shown in Figure 15.
| ID | Risk Description | Probability | Impact | Score | Response | Management (Action) | Follow-up |
|---|---|---|---|---|---|---|---|
| R1 | Delivery (Component delays) | 4 | 4 | 16 | Avoid | Purchase from local suppliers as soon as possible. | Weekly tracking of shipment ID. |
| R2 | Financial Constraint (Budget) | 3 | 4 | 12 | Mitigate | Use recycled materials for non-critical parts. | Bi-weekly review of expense log. |
| R3 | Team Synchronicity | 3 | 3 | 9 | Mitigate | Maintain open communication and shared task boards. | Weekly stand-up progress checks. |
| R4 | Safety Rejection (Metro) | 2 | 5 | 10 | Avoid | Strictly follow the Porto Metro technical manuals. | Regular design reviews with coaches. |
| R5 | Vandalism | 3 | 4 | 12 | Mitigate | Use tamper-proof screws and a robust housing. | Physical integrity testing. |
| R6 | Environmental Durability | 2 | 4 | 8 | Mitigate | Select chemical-resistant polymers for the housing. | Cleaning agent exposure tests. |
| R7 | Cybersecurity | 2 | 4 | 8 | Avoid | Implement encryption and secure QR protocols. | Firmware penetration testing. |
| R8 | Power Supply Instability | 3 | 3 | 9 | Reduce | Implement deep sleep modes in the ESP32 code. | Log power consumption. |
| R9 | Ergonomic Strain | 2 | 3 | 6 | Reduce | Create several 3D-printed prototypes for testing. | User feedback surveys. |
| R10 | Privacy Breach | 1 | 5 | 5 | Avoid | No personal data is collected via the application. | Legal checklist verification. |
3.7.4. Definition of Appropriate Risk Responses
Based on the results, our strategy prioritizes Extreme and High risks. Delivery (R1) and Vandalism (R5) require immediate mitigation through early procurement and robust mechanical design.
For safety and privacy risks (R4, R10) and avoidance strategy is mandatory. We ensure the project is never at risk of legal or institutional rejection by following external regulations.
All secondary risks are monitored through iterative testing to detect any score escalation.
3.8. Procurement
The CONNECT and share procurement strategy balances regulated industrial components with cost-effective prototyping through centralized purchasing and institutional resource utilization. All components are sourced with a primary supplier and a defined fallback to ensure prototype assembly is not blocked by availability issues.
3.8.1. Sources
Three procurement streams are defined:
- Primary Hardware (Buy): Electronic components including microcontrollers (Wemos C3 Mini), WS2813 LED strips, MCP2551 CAN transceivers, and resistors are sourced from Mauser.pt, chosen for its Portuguese presence, competitive pricing, and reliable lead times. In the event Mauser.pt cannot fulfill an order, the fallback suppliers are Mouser Electronics (mouser.com) and Worten (worten.pt), both of which stock equivalent or pin-compatible parts and ship to Portugal within 3 to 5 business days.
- Specialty Materials (Buy): Nanovia PA Rail filament is procured directly from the manufacturer, as it is the only identified EN 45545-2 compliant fire-retardant filament certified for metro rail applications. No equivalent Portuguese supplier exists. Should Nanovia be unavailable or delivery be delayed, the fallback is Polymaker PC-FR or BASF Ultrafuse FR filament, which carry comparable fire-retardancy ratings and are available through 3DJake.com or Filamento.pt with shorter regional lead times.
- Fabrication (Make): Enclosures are 3D printed using ISEP laboratory facilities, reducing cost to raw material only. If ISEP printers are unavailable, a local print service such as Fablab Porto or an online service such as Craftcloud can produce parts from supplied STL files within 2 to 4 days.
3.8.2. Make vs. Buy Decisions
The following Table 16 summarizes the strategic choices for key project elements.
| Item | Decision | Rationale |
|---|---|---|
| Electronic Nodes | Buy | Wemos C3 Mini boards offer greater reliability and lower cost than custom PCBs at prototype stage. |
| Enclosures | Make | 3D printing enables rapid design iteration and custom fit to metro handrail geometry. |
| Sensing Material | Buy | Velostat is a specialized piezoresistive material with no viable in-house alternative. |
| Web Platform | Make | Custom React/Supabase implementation ensures delayed-gratification logic and anonymization requirements are precisely met. |
3.8.3. Cost and Schedule Control
Expenditure is tracked against a detailed bill of materials within the program budget constraints. Component procurement is milestone-gated to ensure availability before prototype assembly begins. For each line item, the primary supplier, unit price, and quantity required are recorded in the BOM alongside the identified fallback supplier and its estimated lead time differential. Miscellaneous passive components are sourced locally where possible to reduce lead times. If a primary supplier quotes a lead time exceeding five business days at a critical milestone, the fallback supplier is activated without waiting for the primary order to fail.), both of which stock equivalent or pin-compatible parts and ship to Portugal within 3 to 5 business days.
- Specialty Materials (Buy): Nanovia PA Rail filament is procured directly from the manufacturer, as it is the only identified EN 45545-2 compliant fire-retardant filament certified for metro rail applications. No equivalent Portuguese supplier exists. Should Nanovia be unavailable or delivery be delayed, the fallback is Polymaker PC-FR or BASF Ultrafuse FR filament, which carry comparable fire-retardancy ratings and are available through 3DJake.com or Filamento.pt with shorter regional lead times.
- Fabrication (Make): Enclosures are 3D printed using ISEP laboratory facilities, reducing cost to raw material only. If ISEP printers are unavailable, a local print service such as Fablab Porto or an online service such as Craftcloud can produce parts from supplied STL files within 2 to 4 days.
3.9. Project Plan
As detailed in the Global Sprint Plan (see 17), the project is divided into 15 distinct sprints.
| Sprint | Start | Finish | Working days |
|---|---|---|---|
| 1 | 5 march | 12 march | 4 days of availability |
| 2 | 12 march | 19 march | 5 days of availability |
| 3 | 19 march | 26 march | 5 days of availability |
| 4 | 26 march | 2 april | 5 days of availability |
| 5 | 2 april | 16 april | 2 days of availability |
| 6 | 16 april | 23 april | 5 days of availability |
| 7 | 23 april | 30 april | 5 days of availability |
| 8 | 30 april | 14 may | 4 day of availability |
| 9 | 14 may | 21 may | 5 days of availability |
| 10 | 21 may | 28 may | 5 days of availability |
| 11 | 28 may | 4 june | 5 days of availability |
| 12 | 4 june | 11 june | 5 days of availability |
| 13 | 11 june | 18 june | 5 days of availability |
The specific tasks and deliverables assigned to these periods are managed in the Project Backlog (see Table 18).
| Timeline | Epic | Ticket code | Ticket title | Status |
|---|---|---|---|---|
| Sprint 1 (5 Mar - 12 Mar) | General / No Epic | SCRUM-3 | Communication presentation | Done |
| Sprint 1 (5 Mar - 12 Mar) | INITIATION & PLANNING | SCRUM-74 | Ideation discussion | Done |
| Sprint 1 (5 Mar - 12 Mar) | SYSTEM DESIGN & DRAWINGS | SCRUM-2 | Blackbox diagram | Done |
| Sprint 1 (5 Mar - 12 Mar) | SYSTEM DESIGN & DRAWINGS | SCRUM-21 | Drawings | Done |
| Sprint 1 (5 Mar - 12 Mar) | SYSTEM DESIGN & DRAWINGS | SCRUM-48 | Structural Drafts | Done |
| Sprint 2 (12 Mar - 19 Mar) | FINAL DELIVERABLES | SCRUM-26 | Flyer | Done |
| Sprint 2 (12 Mar - 19 Mar) | General / No Epic | SCRUM-75 | Selection of Materials & Components V2 | In Progress |
| Sprint 2 (12 Mar - 19 Mar) | General / No Epic | SCRUM-76 | Presentation for Teachers | Done |
| Sprint 2 (12 Mar - 19 Mar) | INITIATION & PLANNING | SCRUM-42 | Backlog, Gantt and Sprint Plan | Done |
| Sprint 2 (12 Mar - 19 Mar) | INTERIM REPORT-WIKI CONTENT | SCRUM-55 | Background and Related Work | In Progress |
| Sprint 2 (12 Mar - 19 Mar) | INTERIM REPORT-WIKI CONTENT | SCRUM-57 | Marketing Plan | In Progress |
| Sprint 2 (12 Mar - 19 Mar) | INTERIM REPORT-WIKI CONTENT | SCRUM-58 | Eco-Efficiency Measures for Sustainability | In Progress |
| Sprint 2 (12 Mar - 19 Mar) | INTERIM REPORT-WIKI CONTENT | SCRUM-73 | Canvas | Done |
| Sprint 2 (12 Mar - 19 Mar) | INTERIM REPORT-WIKI CONTENT | SCRUM-79 | 4.1 Introduction | To Do |
| Sprint 2 (12 Mar - 19 Mar) | INTERIM REPORT-WIKI CONTENT | SCRUM-80 | 4.2 Business Idea Formulation | To Do |
| Sprint 2 (12 Mar - 19 Mar) | INTERIM REPORT-WIKI CONTENT | SCRUM-81 | 4.3 Business Model | To Do |
| Sprint 2 (12 Mar - 19 Mar) | INTERIM REPORT-WIKI CONTENT | SCRUM-82 | 4.4 Market Analysis | To Do |
| Sprint 2 (12 Mar - 19 Mar) | INTERIM REPORT-WIKI CONTENT | SCRUM-83 | 4.5 SWOT Analysis | To Do |
| Sprint 2 (12 Mar - 19 Mar) | INTERIM REPORT-WIKI CONTENT | SCRUM-84 | 4.6 Strategy | To Do |
| Sprint 2 (12 Mar - 19 Mar) | INTERIM REPORT-WIKI CONTENT | SCRUM-85 | 4.7 Marketing Programs | To Do |
| Sprint 2 (12 Mar - 19 Mar) | INTERIM REPORT-WIKI CONTENT | SCRUM-86 | 4.8 Conclusion | To Do |
| Sprint 2 (12 Mar - 19 Mar) | SYSTEM DESIGN & DRAWINGS | SCRUM-49 | Selection of Materials & Components v1 | Done |
| Sprint 2 (12 Mar - 19 Mar) | SYSTEM DESIGN & DRAWINGS | SCRUM-50 | Name and Logo | Done |
| Sprint 3 (19 Mar - 26 Mar) | General / No Epic | SCRUM-77 | Ethics Scandal PowerPoint | To Do |
| Sprint 3 (19 Mar - 26 Mar) | SYSTEM DESIGN & DRAWINGS | SCRUM-51 | Detailed Schematics | To Do |
| Sprint 3 (19 Mar - 26 Mar) | SYSTEM DESIGN & DRAWINGS | SCRUM-52 | Structural Drawings | To Do |
| Sprint 3 (19 Mar - 26 Mar) | SYSTEM DESIGN & DRAWINGS | SCRUM-53 | Cardboard Model | To Do |
| Backlog | CLOSING | SCRUM-63 | Update Wiki & MS Teams (Final Deliverables) | To Do |
| Backlog | FINAL DELIVERABLES | SCRUM-20 | Final List of Materials & Components | To Do |
| Backlog | FINAL DELIVERABLES | SCRUM-23 | Code | To Do |
| Backlog | FINAL DELIVERABLES | SCRUM-24 | 3D Model Video | To Do |
| Backlog | FINAL DELIVERABLES | SCRUM-25 | Flyer | Done |
| Backlog | FINAL DELIVERABLES | SCRUM-27 | Packaging Solution | To Do |
| Backlog | FINAL DELIVERABLES | SCRUM-28 | Manual | To Do |
| Backlog | FINAL DELIVERABLES | SCRUM-29 | Simulations | To Do |
| Backlog | FINAL DELIVERABLES | SCRUM-32 | Final Report | To Do |
| Backlog | FINAL DELIVERABLES | SCRUM-33 | Final Presentation | To Do |
| Backlog | FINAL DELIVERABLES | SCRUM-34 | Paper | To Do |
| Backlog | FINAL DELIVERABLES | SCRUM-35 | Poster | To Do |
| Backlog | FINAL DELIVERABLES | SCRUM-36 | Video | To Do |
| Backlog | FINAL DELIVERABLES | SCRUM-62 | Selection of Local Providers | To Do |
| Backlog | General / No Epic | SCRUM-30 | Interim Report | To Do |
| Backlog | INTERIM REPORT-WIKI CONTENT | SCRUM-54 | Introduction | To Do |
| Backlog | INTERIM REPORT-WIKI CONTENT | SCRUM-56 | Project Management | To Do |
| Backlog | INTERIM REPORT-WIKI CONTENT | SCRUM-59 | Ethical and Deontological Concerns | To Do |
| Backlog | INTERIM REPORT-WIKI CONTENT | SCRUM-60 | Project Developments | To Do |
| Backlog | INTERIM REPORT-WIKI CONTENT | SCRUM-61 | Conclusions | To Do |
| Backlog | PROTOTYPE DEVELOPMENT | SCRUM-69 | Figma Designs for Message Application | To Do |
| Backlog | PROTOTYPE DEVELOPMENT | SCRUM-78 | Message Application code | To Do |
| Backlog | TESTING | SCRUM-66 | Functional testing | To Do |
| Backlog | TESTING | SCRUM-67 | Non-functional testing | To Do |
| Backlog | TESTING | SCRUM-68 | User-acceptance testing | To Do |
The high-level distribution of Epic responsibilities across the timeline is summarized in the Initial Sprint Plan (see Table19).
| Sprint | Start | Finish | Epics | Responsible |
|---|---|---|---|---|
| 1 | 5 march | 12 march | INITIATION & PLANNING | All |
| 2 | 12 march | 19 march | INITIATION & PLANNING; SYSTEM DESIGN & DRAWINGS; FINAL DELIVERABLES | All |
| 3 | 19 march | 26 march | INITIATION & PLANNING; SYSTEM DESIGN & DRAWINGS | All |
| 4 | 26 march | 2 april | SYSTEM DESIGN & DRAWINGS; INTERIM REPORT & PRESENTATION | All |
| 5 | 2 april | 9 april | INTERIM REPORT & PRESENTATION | All |
| 6 | 9 april | 16 april | PROTOTYPE CONSTRUCTION; FINAL DELIVERABLES | All |
| 7 | 16 april | 23 april | PROTOTYPE CONSTRUCTION; FINAL DELIVERABLES | All |
| 8 | 23 april | 30 april | PROTOTYPE CONSTRUCTION; FINAL DELIVERABLES | All |
| 9 | 30 april | 7 may | PROTOTYPE CONSTRUCTION; FINAL DELIVERABLES | All |
| 10 | 7 may | 14 may | PROTOTYPE CONSTRUCTION; FINAL DELIVERABLES | All |
| 11 | 14 may | 21 may | PROTOTYPE CONSTRUCTION; FINAL DELIVERABLES | All |
| 12 | 21 may | 28 may | PROTOTYPE CONSTRUCTION; FINAL DELIVERABLES | All |
| 13 | 28 may | 4 june | FINAL REPORT, PRESENTATION & VIDEO | All |
| 14 | 4 june | 11 june | FINAL REPORT, PRESENTATION & VIDEO | All |
| 15 | 11 june | 18 june | FINAL REPORT, PRESENTATION & VIDEO ; FINAL DELIVERABLES | All |
Lastly, the visual dependencies and duration of these tasks are illustrated in the Gantt Chart (see Figure 7).

3.10. Sprint Outcomes
Sprints 1 & 2 were not managed in Jira and there were no specific tasks to be done. However, the idea of the project had been forming before Sprint 3 and some outcomes were achieved such as:
- Black Box Diagram V1
- Structural Drawings V1
- Selection of materials and components V1
- Inicial sketches of our project idea
3.10.1 Sprint 3 Outcome
As illustrated in Figure 8, the Sprint 3 Burndown Chart captures our very first agile tracking cycle and the initial progress trends of the team.

In Sprint 3 we consolidated both the technical foundation of the project and the supporting documentation. The team completed all planned issues in Jira, with no carry‑over work. Key outcomes included updated structural drawings and schematics (V2), the cardboard model, and a refined selection of materials and components. We also advanced the digital side with Figma designs for the message application and progressed written deliverables such as the background/related work and eco‑efficiency measures. Routine work like daily meetings, the sprint retrospective, and logbook updates was completed, ensuring the project stayed aligned and well documented.
- Why the velocity report/burndown looks like this: Being our first sprint managed in Jira, the chart reflects initial planning chaos. The scope (red line) suddenly spiked mid-sprint because we committed the mistake of scope creep, adding major deliverables like the Cardboard Model and V2 designs on the fly instead of locking the backlog on day one.
- The Good and the Bad (Why we didn't complete 100%): The bad habit was a prolonged flatline at zero due to last-minute status changes; the team was working in the lab but forgot to update Jira progressively. On the good side, a powerful final surge allowed us to bulk-update and close the core technical foundations just before the deadline.
- Retrospective & Group Dynamic: We realized that our initial estimations were pure guesswork due to a lack of historical data. For the next cycles, we officially banned adding any new tasks once a sprint is active and established a strict rule for real-time status updates.
3.10.2 Sprint 4 Outcome
To analyze our development velocity during the middle phase of development, Figure 9 outlines the task execution line and workload behavior for Sprint 4.

In Sprint 4 we advanced both the written deliverables and the technical foundations of the CONNECT and share system. The team completed the core report chapters (Introduction, Background & Related Work, Marketing Plan, Eco‑Efficiency Measures, Ethical & Deontological Concerns) and updated the project wiki start page, ensuring the documentation is coherent and aligned with the project vision. On the technical side, we produced Structural Drawings V3 with measurements, Detailed Schematics V3, a general software flow chart, and updated the list of materials and components, while also finalizing the clickable web app prototype and the design system/brand guidelines. Routine process tasks such as daily meetings, the sprint retrospective, and logbook updates were completed, keeping communication and traceability strong. Some higher‑effort items like Chapter 3 – Project Management, Chapter 7 – Project Developments, and the Interim Presentation remained in progress and will be continued in Sprint 5.
- Why the velocity report/burndown looks like this: In Sprint 4, we grew overly ambitious and massive overestimation took place, setting a giant baseline of over 110 Story Points. The scope stayed flat, but our completed work (green line) shows that we finished barely 50% of what we promised, revealing a clear bottleneck in our velocity.
- The Good and the Bad (Why we didn't complete 100%): The bad part was a severe technical roadblock: our hardware team hit a logic level nightmare with the WS2813 LED strips and the ESP32 (3.3V vs 5V logic), which paralyzed firmware progression. The good part was that we successfully advanced massive blocks of written documentation and finalized the clickable web app prototype layout.
- Retrospective & Group Dynamic: The team learned a harsh lesson about technical dependencies. We agreed that high-risk hardware integrations must be prioritized early in the sprint and assigned fewer story points to general documentation to balance the workload.
3.10.3 Sprint 5 Outcome
The tracking data exported from Jira in Figure 10 displays the evolution of our remaining effort during Sprint 5, highlighting a noticeable stagnation phase.

- Why the velocity report/burndown looks like this: The burndown line shows a flat zero progress for the first full week of the cycle, followed by mid-sprint scope changes where the red line expanded. We suffered a noticeable completion gap, leaving nearly a third of the story points completely uncompleted at the deadline.
- The Good and the Bad (Why we didn't complete 100%): The bad side was a total drop in group momentum due to the Easter holidays. The festive break and travel schedules completely destabilized our operational cadence. On the good side, our high resilience allowed the team to reunite immediately after the break to front-load effort, pushing structural drawings (V3) and detailed schematics over the line.
- Retrospective & Group Dynamic: We recognized that statutory holidays can completely break the project flow if tasks are not scheduled around them. We determined that for future holiday periods, we must front-load deliverables or officially downscale the sprint capacity beforehand to align with real availability.
3.10.4 Sprint 6 Outcome
In Figure 11, the generated sprint report uncovers a pronounced flatline pattern that dominated the majority of our Sprint 6 tracking timeline.

- Why the velocity report/burndown looks like this: This chart shows an extreme case of “Student Syndrome” flatlining. The green line stays flat at zero points for almost the entire duration of the sprint, showing a single sharp vertical drop on the absolute final day to clear less than half of the total commitment.
- The Good and the Bad (Why we didn't complete 100%): The bad element was a severe communication breakdown regarding task ownership, leading to multiple team members waiting for others to finish pre-requisite components. The good aspect was that the work completed, although late, successfully cleared critical low-power firmware states and standby current optimizations.
- Retrospective & Group Dynamic: We realized that unassigned tasks in the backlog lead to total operational paralysis. The group enforced a strict retrospective rule: every single active Jira task must have a clear individual owner and explicit sub-tasks before a sprint is cleared to launch.
3.10.5 Sprint 7 Outcome
Figure 12 presents the real-world metrics from our seventh sprint iteration, demonstrating how technical challenges affected our daily work logging.

- Why the velocity report/burndown looks like this: The chart displays an erratic scope line at the start and another flatline spanning the entire middle week. While we managed to increase our overall velocity compared to past weeks, we still faced a major deficit at the close of the cycle.
- The Good and the Bad (Why we didn't complete 100%): The bad habit was our ongoing resistance to daily logging, keeping task updates confined to the weekend. On the positive side, the hardware team successfully mitigated floating ADC noise on the Velostat sensor by validating the new mechanical housing, which unblocked the core input conditioning firmware.
- Retrospective & Group Dynamic: We resolved to schedule mandatory, physical co-working sessions instead of relying on individual remote tracking.
3.10.6 Sprint 8 Outcome
The graphic evaluation provided in Figure 13 highlights the operational changes made during Sprint 8, where a downscaled scope strategy was implemented.

- Why the velocity report/burndown looks like this: In Sprint 8, we significantly lowered our target capacity to roughly 32 Story Points. The burndown line looks slightly better, showing an early step-down drop before flatlining in the middle and concluding with a small final delivery gap.
- The Good and the Bad (Why we didn't complete 100%): The good part is that lowering our scope allowed the team to breathe and focus on quality, achieving a much higher completion percentage. The bad part was that a critical dependency on the cork housing assembly delayed our physical integration, preventing a perfect 100% completion rate.
- Retrospective & Group Dynamic: This sprint proved that downscaling our capacity based on historical reality was the correct management choice. We decided to keep our sprint targets realistic rather than over-promising unachievable milestones to the supervisors.
3.10.7 Sprint 9 Outcome
As detailed in Figure 14, the sprint history reveals a more progressive and steady downward burn of tasks, indicating a maturation of team logging discipline.

- Why the velocity report/burndown looks like this: This chart reflects an improved, more progressive downward trend in the green line during the mid-sprint phase, breaking our traditional flatline habit, though a sudden late scope increase slightly altered the final tracking margin.
- The Good and the Bad (Why we didn't complete 100%): The good habit was that the team finally began updating Jira tasks mid-week, reflecting true daily laboratory efforts.
- Retrospective & Group Dynamic: Our group velocity finally started to show predictable patterns. The retrospective focus centered on padding out our software testing windows, acknowledging that external API integrations always introduce unpredictable delays.
3.10.8 Sprint 10 Outcome
Figure 15 details the workload distribution and steep final steps that occurred during the closing phase of Sprint 10 as assembly deadlines neared.

- Why the velocity report/burndown looks like this: This burndown shows a very slow start with a sudden, massive vertical drop on the absolute last day. The scope line was modified with late additions towards the end of the timeline, pushing our target limits.
- The Good and the Bad (Why we didn't complete 100%): The bad side was a return to bulk-updating tasks at the last minute due to the rush of preparing final project deliverables.
- Retrospective & Group Dynamic: With the final presentations approaching, group dynamics shifted into high-pressure execution mode. We learned that while last-minute rushes deliver results, they compromise our tracking accuracy, highlighting the need for better stress distribution across the weeks.
3.10.9 Sprint 11 Outcome
The final metrics dashboard visualized in Figure 16 displays our optimal burndown alignment, matching our most efficient development cycle.

- Why the velocity report/burndown looks like this: Sprint 11 shows a highly progressive step-like burndown chart, displaying clear, active drops across the middle days of the cycle. Although a late scope expansion was introduced, the green line closely followed the ideal directive slope.
- The Good and the Bad (Why we didn't complete 100%): The great success was that we achieved our highest task completion rate of the semester, successfully stabilizing the CAN Bus network and locking down the QR web application routing. The only negative aspect was that minor presentation formatting details had to be pushed to Sprint 12.
- Retrospective & Group Dynamic: This sprint proved that breaking down tasks into granular pieces (under 5 story points) yields excellent tracking metrics and constant progress. The group dynamic reached full agile maturity just in time for the final project closeout.
3.10.10 Sprint 12 Outcome
Figure 17 presents the tracking metrics and burndown trend from Sprint 12, highlighting the critical challenges faced by the team during the late-stage integration phase.

- Why the velocity report/burndown looks like this: The chart shows a severe execution gap, where we completed less than 50% of our planned tasks (reaching only around 17 Story Points out of 38). Furthermore, the scope (red line) shows unexpected increases both at the very beginning and at the absolute deadline, proving that we suffered from late-stage scope creep by adding unplanned emergency tasks on the fly.
- The Good and the Bad (Why we didn't complete 100%): When combining the hardware and software systems, we discovered critical bugs, communication lags, and power instability that flatlined our progress (green line) between June 4th and June 8th. The good side was that once these technical bottlenecks were unblocked, the team achieved an acceleration during the final days to rescue the core data routing features.
- Retrospective & Group Dynamic: We realized that leaving complex integrations for the next sprint was a high-risk management mistake. In our retrospective, we decided that the final cycle (Sprint 13) must be completely locked with zero new features, dedicating 100% of our remaining capacity to fixing small things and perfecting the final presentation.
3.11. Sprint Evaluations
Sprint evaluations and retrospectives are fundamental to the team’s Agile workflow, allowing for continuous process improvement. Starting from Sprint 3, the team implemented formal retrospective sessions to identify bottlenecks and refine internal methodologies.
3.11.1. Sprint 3 Retrospective
In this sprint, the focus was on establishing the technical foundation. The retrospective revealed significant gaps in task granularity and time management.
Retrospective Summary:
- Positive (+): Effective feedback loops with professors and proactive note-taking during presentations.
- Negative (-): Vague backlog items, inconsistent Jira updates, and poor workload distribution.
- Action Plan: The team committed to breaking down tasks into sub-tasks (max 4h each) and ensuring Jira is updated daily.
3.11.2. Sprint 4 Retrospective
Following the action plan from the previous sprint, Sprint 4 showed a marked improvement in organization and team morale.
Retrospective Summary:
- Positive (+): High motivation, excellent mutual support, and a much more balanced task distribution.
- Negative (-): No major process blockers identified; the workflow reached a stable state.
- Action Plan: Focus on maintaining the current communication frequency and standardizing the documentation style for the upcoming deliverables.
3.11.3. Sprint 5 Retrospective
Sprint 5 centered on the team's first formal presentation. The retrospective highlighted strong collaboration and timely delivery, but identified gaps in presentation rehearsal and logistics.
Retrospective Summary:
- Positive (+): Strong mutual support, high motivation, timely task completion, and a well-received presentation.
- Negative (-): Last-minute changes to slides and script, lack of in-person group rehearsal, and unclear stage roles and transitions.
- Action Plan: The team agreed to freeze presentation content 24 hours before the deadline, schedule a mandatory in-person dry run, and explicitly assign stage positions and slide control responsibilities during planning.
3.11.4. Sprint 6 Retrospective
Sprint 6 focused on production of key deliverables, including the promotional video, 3D model, and marketing materials. The retrospective reflected strong output but flagged recurring carry-over as an area for improvement.
Retrospective Summary:
- Positive (+): Clear task ownership, consistent progress on the web app, and successful completion of major deliverables including the video and 3D model.
- Negative (-): Some tasks carried over across multiple sprints, indicating insufficient task breakdown during planning.
- Action Plan: The team committed to decomposing tasks into smaller, more manageable steps from the outset of each sprint to reduce carry-over.
3.11.5. Sprint 7 Retrospective
Sprint 7 saw the completion of several key deliverables and continued web app progress. The retrospective identified procrastination as the main obstacle to a smoother workflow.
Retrospective Summary:
- Positive (+): Clear task division, steady web app progress, and successful completion of the provider list, materials list, video, and 3D model.
- Negative (-): Procrastination led to tasks being completed later in the sprint than planned.
- Action Plan: The team committed to starting tasks earlier in each sprint cycle to maintain a more consistent workload distribution.
3.11.6. Sprint 8 Retrospective
Sprint 8 we had strong team cohesion and worked efficient with tasks. The retrospective identified no significant areas for improvement.
Retrospective Summary:
- Positive (+): Strong collaboration and communication across the team, clear task ownership, and well-balanced workload distribution.
- Negative (-): No process issues identified.
- Action Plan: The team agreed to maintain the current working dynamic and communication standards going forward.
3.11.7. Sprint 9 Retrospective
Sprint 9 delivered comunication/visual material that received good feedback and continued web app progress, but exposed workflow gaps tied to component delays and tasks that carried over several sprints.
Retrospective Summary:
- Positive (+): Positive supervisor feedback, completion of the leaflet, poster, and visual materials, and continued steady progress on the web app.
- Negative (-): Several tasks carried over across multiple sprints, and prototype work was blocked pending component delivery.
- Action Plan: The team committed to improving workflow oversight to better anticipate blockers and prevent task accumulation.
3.11.8. Sprint 10 Retrospective
Sprint 10 was a stable sprint with most tasks completed as expected. The team acknowledged the need to pick up the pace as the project deadline draws closer.
Retrospective Summary:
- Positive (+): Tasks were mostly completed as planned.
- Negative (-): The team recognized the need to work more intensively in the final sprints.
- Action Plan: The team committed to increasing the work pace to meet final deadlines.
3.11.9. Sprint 11 Retrospective
Sprint 11 featured a successful marketing pre-presentation and good team communication. Carrying over tasks remained as an ongoing challenge.
Retrospective Summary:
- Positive (+): Successful marketing pre-presentation and strong team communication.
- Negative (-): Some tasks carried over across multiple sprints.
- Action Plan: The team committed to breaking tasks into smaller steps from the start of each sprint so they don’t carry over several sprints.
3.12. Summary
This chapter detailed the management strategies used to organize and track the project's progress. We established the core foundations for scope, time, and cost, while also setting up protocols for quality, risk, and procurement. Managing communications and stakeholders was also key to keeping the workflow consistent and transparent.
These management pillars are put into practice through a cycle of continuous planning and execution. The Sprint outcomes and evaluations documented here reflect our ongoing effort to refine the workflow and hit project milestones. With the management structure in place, the focus now shifts to the Marketing Plan to define the project's market strategy and value proposition.
4. Marketing Plan
4.1 Introduction
This chapter outlines the formulation of the business idea and the strategic marketing approach developed to bring CONNECT and share to the market.
It covers:
- Business Idea Formulation: Definition of the core concept, outlining the multisensory value proposition, and establishing the problem-solution fit to combat digital isolation on public transport.
- Business Model: Identification of both B2B (public transport authorities) and B2C (daily commuters) target markets, alongside the differential value of a zero-friction interactive experience.
- Market Analysis: A comprehensive evaluation of the macro-environment using the PESTEL framework to assess the Political, Economic, Social, Technological, Environmental, and Legal factors influencing the project.
- SWOT Analysis: A structured assessment of the project's internal strengths and weaknesses, combined with external market opportunities and threats.
- Strategy: The strategic roadmap detailing the segmentation and targeting of Young Urban Commuters, and how the project is positioned against passive digital consumption.
- Marketing-Mix & Brand: The application of the 4 Cs framework (Customer value, Cost, Convenience, Communication) to center the user perspective, and the definition of CONNECT and share's core values and brand personality.
- Marketing Programmes: The planned marketing initiatives, budget allocation, and control mechanisms required to execute the strategy.
- Summary: The final conclusions that justify the product's market fit and bridge the strategic decisions to the next phase of development.
The traditional aim of marketing is to identify and meet the needs of consumers in a way that creates value and builds long-term relationships. For the CONNECT and share project, however, we specifically apply the principles of social marketing. Social marketing uses marketing knowledge and techniques to achieve social goals, with the benefits primarily accruing to the target group or society as a whole, rather than solely to the seller.
CONNECT and share transforms the monotonous daily commute on public transport into an interactive experience that breaks through the modern-day ‘digital bubble’. Using sensors and LED lighting, we turn a routine journey into a multi-sensory experience that reconnects people with the real world. For the CONNECT and share project, we apply the principles of social marketing, which focuses on influencing voluntary behavior to improve societal welfare rather than just building awareness [27].
4.2. Business Idea Formulation
To successfully bring our vision to market, we place the traveller’s needs at the very heart of our design process. According to the core concept of marketing, everything revolves around identifying and fulfilling customer needs. Our Business Idea Formulation therefore starts with a sharp analysis of a current social pain point, to which we propose a solution that is not so much a ‘product’ as one that delivers tangible, emotional value.
4.2.1 Problem-Solution Fit
- The Problem: Shared transport has nowadays become a space of digital isolation and social disconnection. Passengers avoid eye contact, and excessive screen use contributes to stress, passivity and mental fatigue.
- The Solution: CONNECT and share breaks through this isolation in an accessible way. As soon as a passenger holds onto a handrail in the metro (an everyday and necessary action), a personal light colour travels to the ceiling, blending with the colours of other passengers. To continue this shared experience outside the metro, a QR code at the exit allows passengers to exchange anonymous messages, about life lessons. An intentional delay, whereby passengers can read the messages after their journey, ensures that they remain in the moment and away from their screens during the journey.
4.2.2 Value Creation
A fundamental principle in marketing is that customers do not buy products, but benefits [28]. CONNECT and share focuses strongly on the emotional dimension of brand value and creates profound emotional benefits for the user. We maximise Perceived Value by offering a moment of calm and human connection in what is typically a stressful environment. Our value proposition rests on three pillars: - Sensory Grounding & Visualisation: Solitary scrolling is replaced by a real-time visual representation of human connection, where the user’s touch translates into streams of light.
- Zero-Friction Socialising: Strangers are connected through a simple action without the need for screens or phones during the journey.
- Active Co-creation & Emotional Exchange: Passengers transform from passive travellers into active co-creators of their physical environment (lights) and digital community (messages).
4.2.3 Optimal Value Proposition
A successful market offering requires an Optimal Value Proposition (OVP) based on the 3-V framework, which means it must create superior value for the three core entities in the market:
- Customer Value (The Passenger): We increase value for the customer by responding to emotional needs. Passengers experience moments of wonder, intimacy and a sense of connection without having to make any extra effort.
- Collaborator Value (Metro do Porto & Sponsors): We create superior value for our key partners (Collaborators), such as Metro do Porto, by humanising their infrastructure and significantly improving the customer experience. This leads to higher customer satisfaction, stronger brand loyalty and an innovative image as a forward-thinking ‘Smart City’ solution.
- Company Value (Our Team/Company): The project creates value for us as an organisation by positioning us as pioneers in ethical, well-being-focused urban technology. This opens doors to future scalability, grants and B2G collaborations.
4.3. Business Model
To access the Big Idea Canvas please follow this link.
A Business Model Canvas has been drawn up to define the value of CONNECT and share. This strategic tool provides a clear visualisation of how the project generates, delivers and captures value from two main perspectives:
- Passenger experience and social impact
- Logistics, engineering and infrastructure
CONNECT and share’s business model operates within a hybrid Business-to-Government (B2G) and Business-to-Business (B2B) structure. To understand how we exchange value, we apply the “6-V Framework” (Value Exchange). This model identifies the key entities in the target market: customers, the company, collaborators and competitors. Within CONNECT and share, this is closely linked to Relationship Marketing: our aim is to build meaningful, long-term relationships with both our users and our partners in the wider marketing environment.
4.3.1 Customer Segments & Relationships
Our target group (Customer Segments) consists mainly of “The Digital Exhausted” (young, urban commuters aged 18–45), regular travellers and city enthusiasts. The relationship we build with them (Customer Relationships) is not transactional, but revolves around active co-creation and a shared sense of urban connectedness. The channels (Channels) used to reach them are primarily direct and tactile (via the sensors in the handrails) and then digital (via the QR codes in the underground stations).
4.3.2 Primary Exchange Relationship & Object Pillar
To understand CONNECT and share as a brand, we use Paulo Lencastre's Brand Triangle [29], which looks at a brand from three angles: identity, object, and response.
- The Identity Pillar covers what the brand looks and feels like — the name, the flowing light patterns on the ceiling, and the minimalist QR interface.
- The Object Pillar is the actual exchange offered: an interactive installation that improves the passenger experience, in return for infrastructure access and financial support from partners like Metro do Porto.
- The Response Pillar is about perception: the emotional associations we want to build with passengers and partners. We want CONNECT and share to feel warm and human.
Each of these pillars is developed further in Section 4.6.5.
4.3.3 Revenue Streams and Cost Structure
The logistics, engineering and infrastructure entail a Cost Structure, including the production of hardware kits (sensors, microcontrollers), installation, and crucial maintenance (where protection against and repair following vandalism plays a key role). However, the financing is not borne by the end-user. Instead, we generate revenue through the following revenue streams:
- B2G Contracts: Service fees paid by public authorities, such as Metro do Porto, for improving the User Experience (UX).
- Corporate Sponsorships (B2B): Revenue from socially responsible brands wishing to promote themselves in relation to mental wellbeing and social impact.
- Urban Social Analytics: Providing anonymised reports on urban wellbeing and sentiment to city councils.
- Grants: Financial support from cultural or innovation funds focused on urban social dynamics.
Figure 18 maps out the hybrid Business-to-Government and Business-to-Business aproach, ensuring the project's sustainability within the Porto Metro ecosystem.

4.4. Market Analysis
A successful marketing strategy must always be grounded in a thorough market analysis. To shape our strategy, we analyse the marketing environment: the external factors and forces that influence our ability to build and maintain successful relationships with our target audience. This environment is divided into the macro-environment and the micro-environment.
4.4.1. Macro-environment (PESTEL Factors):
The Macro-environment consists of the broader societal forces that influence the Micro-environment. To systematically examine these external variables and anticipate challenges and opportunities, we use a Political, Economic, Social, Technological, Environmental, Legal (PESTEL) analysis, a widely recognized tool to categorize macro-environmental drivers of change [30].
By identifying these factors, we can anticipate potential challenges and see the opportunities. Figure 19 provides a summary of these external drivers.

Table 20 offers a detailed breakdown of how each specific factor directly relates to the development and strategic goals of CONNECT and share.
| Factor | Rationale |
|---|---|
| P - Political |
|
| E - Economic |
|
| S - Social |
|
| T - Technological |
|
| E - Environmental |
|
| L - Legal |
|
4.4.2. Micro-environment (Porter’s 5 Forces):
The micro-environment comprises the forces close to the company that influence our ability to serve the customer, such as customers, competitors and suppliers. To evaluate the competitive intensity within the Porto Metro ecosystem, we apply Porter’s Five Forces model, which asserts that industry competition is rooted in its underlying economic structure [31].

- Customer Bargaining Power:
- Very High
- The customer is defined within a Business-to-Government (B2G) structure, or what the theory refers to as ‘Government markets’. Our primary customer is the infrastructure operator: Metro do Porto. As they are the sole entity with absolute control over the public space, they possess enormous bargaining power. CONNECT and share must align perfectly with their Corporate Social Responsibility (CSR) objectives to be successful.
2. Threat of Substitution:
- High
- The biggest “competitor” and also the most disruptive force for CONNECT and share is not another media company, but the traveller’s personal smartphone. The desire for digital isolation is a direct substitute for our physical interaction. Our mitigation strategy is not to fight the phone, but to use it as an ally in “Phase 2” via the QR code, provided there is an intentional delay.
3. Competitive Rivalry:
- Low
- Our traditional competitors serve the same target market with similar services. Although the advertising market in public transport is saturated with static and digital screens, we are creating an entirely new niche: sensory wellbeing. We have no direct rivals who transform street furniture (such as handrails) into a human, co-creative interface.
4. Threat of New Entrants:
- Low / Medium
- The barriers to entry are significant. Strict technical and safety certifications (fire safety, electƒrical inspections) are required to install hardware in railway rolling stock. Once CONNECT and share has been integrated via a public concession, the infrastructure forms a solid barrier to new competitors.
5. Supplier Power:
- Low / Medium
- Suppliers are the link that provides us with the necessary resources (sensors, LEDs). However, the components for CONNECT and share are open-market technologies offered by many manufacturers. Our dependence is low; the real value lies in our software integration and ‘experience design’, not in the exclusivity of the hardware.
CONNECT and share's success in this microenvironment depends on managing the high dependence on the institutional client (Metro) and offering an experience attractive enough to overcome the inertia of isolation generated by mobile devices.
4.5. SWOT Analysis
According to the Marketing Strategy Planning Process, the Strengths, Weaknesses, Opportunities, Threats (SWOT) analysis is the strategic intersection where our internal business environment (Company) and the external market environment (Customers & Competitors) converge [33] [34]. This model, presented in Figure 21, helps us to balance the internal Strengths and Weaknesses of the CONNECT and share concept with the external Opportunities and Threats in the market. This analysis forms the basis for our differentiation and positioning strategy.

Internal Factors (Company’s Internal Environment)
Strengths:
- Strong Emotional Value Proposition: Within the Value Creation framework, CONNECT delivers significant emotional benefits by combating loneliness and facilitating genuine human connection.
- Intuitive and Frictionless Design: The interaction requires no learning curve and is extremely accessible. Passengers naturally hold onto the handrails, which enables ‘Zero-Friction Socialising’.
- Reduction in Screen Time: Phase 1 of our project requires no smartphones, allowing passengers to be fully present in the physical space.
- Delayed Digital Reward (Delayed Gratification): The deliberate delay in Phase 2, where the QR code is only scanned upon exiting the train ensures that the physical journey remains a shared, mindful experience.
- High Scalability: Once proven successful, this ambient media concept can be rolled out relatively easily to other cities or modes of transport (buses, trains).
Weaknesses:
- Early Development Stage & Limited Resources: As a start-up concept, we have a limited initial budget, which makes the development and testing of robust physical prototypes challenging.
- Dependence on Public Administration (Micro-environment): As the design requires physical modifications to the rolling stock, implementation is heavily dependent on permits and approvals from public authorities (Metro do Porto).
- Vulnerability of Hardware & Maintenance: The use of physical technology (sensors, RGB LEDs) in a public, high-traffic area entails significant risks in terms of vandalism and high maintenance costs.
- User friction in Phase 2: Asking passengers to scan a QR code whilst alighting introduces a barrier (friction) that may reduce the participation rate for listening to or recording messages.
External Factors (External Market Environment)
Opportunities:
- Cultural Shift Towards Mental Wellbeing (Macro - Social/Cultural): There is a growing social trend (particularly among younger generations) focused on mental wellbeing and digital detoxing. CONNECT aligns seamlessly with this as an ethical intervention.
- Social Marketing Funding: As CONNECT serves a social and societal purpose (Social Marketing), the concept is highly attractive for grants and funding from public and private NGOs.
- Partnerships in Shared Transport (Micro - Collaborators): Governments and local transport companies are constantly seeking innovative ways to increase customer satisfaction and encourage the use of public transport.
Threats:
- Inherent Consumer Habits (Cultural Inertia): It is extremely difficult to change the ingrained behaviour of passengers who are accustomed to ignoring their surroundings and remaining in their digital bubble.
- Strict Safety Regulations (Macro-Political/Legal): The rail sector is subject to extremely strict safety standards (such as fire safety), which can impose significant limitations on the materials we are permitted to install on handrails and ceilings.
- Economic Constraints (Macro-Economic): Economic recessions or cuts to local authority budgets may lead transport authorities to be reluctant to invest in infrastructure.
4.6. Strategy
4.6.1 Strategic Objectives
CONNECT’s strategic direction is based on tangible objectives, designed to validate our impact on urban social dynamics. As we operate from a social marketing perspective, our primary objective is not to generate financial profit, but to influence and transform passenger behaviour.
- Behavioural Change: We aim to break through passive consumption inertia. The objective is to measurably increase the percentage of passengers who put their smartphones away for 30 to 60 seconds between stops during the three-month pilot phase.
- Co-creation & Engagement (Customer Involvement): To bridge the gap between physical presence and digital reflection, we are focusing on active participation in Phase 2. Our goal is to establish a baseline engagement rate by collecting an initial corpus of anonymous contributions (stories or life lessons) via the QR interface to validate platform viability within the first 30 days.
4.6.2 Segmentation and Targeting
To design an effective marketing mix, we cannot target every metro passenger. We use market segmentation to define a specific target group. Our primary target group is the Young Urban Commuter (Gen Z and Millennials, aged 18–45). This segment meets the criteria for effective segmentation: it is measurable, accessible, substantial in size, actionable and responds conceptually differently to our campaigns than other groups. We define this segment using the following variables: Demographic: University students and young professionals (aged 18–45) who live, study or work in Porto. Behavioural: Daily commuters whose current habit (usage rate and status) consists of passively scrolling on a smartphone during their journey. They are highly digitally literate, meaning the barrier to interacting with QR codes (Phase 2) is virtually non-existent. Psychographic: This group has a lifestyle strongly influenced by the paradox of ‘being alone together’. They often experience digital fatigue, yet at the same time place great value on authentic self-expression, mental wellbeing and purpose-driven initiatives in the real world.
4.6.3 Positioning
Positioning determines how we want our target group to perceive CONNECT in relation to competitors. Our biggest competitor for the commuter’s attention is the smartphone. A strong positioning strategy requires two elements: Identification and Differentiation.
- Identification (Points of Parity): Just like the smartphone or traditional underground adverts, we are a legitimate way of passing the time and processing stimuli during the commute.
- Differentiation (Points of Differentiation): Whilst phones encourage passive consumption and isolation, CONNECT positions itself through a unique competitive advantage: active, shared physical co-creation.
Our Positioning Statement: ‘For young, urban commuters who value real-world connection, CONNECT is the sensory metro experience that transforms an everyday journey into a moment of shared art and authentic human connection.’
4.6.4. Marketing-Mix
To implement our strategy, we shift from the traditional seller-focused 4Ps to the 4Cs framework to better align with a modern, customer-centric marketing approach [35]. Our marketing-mix is explained in Figure 22.

Customer Value (instead of Product):
- Customers do not buy products; they buy benefits. CONNECT is not a collection of sensors and LEDs; the true customer value lies in the emotional value of shared creativity and the elimination of isolation.
Cost (instead of Price):
- Price is more than just money; it encompasses monetary costs, time, and energy/effort. Because CONNECT is free, our cost consists solely of the physical and psychological effort required of the user. Through intuitive design, we keep this ‘psychological price’ extremely low.
Convenience (rather than Place):
- Accessibility is crucial. Rather than forcing passengers to go to a new location, we integrate CONNECT right where they already are and what they’re already touching: the handrails on the busiest underground lines.
Communication (rather than Promotion):
- Promotion is about one-way broadcasting; communication is a two-way street. We use guerrilla marketing in stations and focus on sharing the real stories collected during Phase 2 to build authentic, long-term relationships (Relationship Marketing).
4.6.5 Brand
Building a strong brand involves much more than simply slapping a name on a product. Within modern marketing management, we analyse CONNECT using Paulo Lencastre’s holistic Brand Triangle, which consists of three pillars:
- Identity Pillar (Identity Mix): This encompasses the brand’s identity. For CONNECT, this comprises our core identity (the name) and our augmented identity, consisting of the distinctive, flowing light patterns on the metro ceiling and the minimalist QR interface.
- Object Pillar (Marketing Mix): This is the actual exchange relationship with the market. For our brand, this is the physical, interactive technological installation that we provide to Metro do Porto and its passengers.
- Response Pillar (Image & Public Mix): This concerns the associations that the target audience has with our brand. We consciously build a strong emotional dimension (Emotional Branding). The brand personality is not a cold technological system, but a warm, honest ‘friend’ in the city. By employing Relationship Marketing, we build trust and ensure a high share of mind and share of esteem among both passengers and public sector employees.
Design System
To ensure a consistent user experience and streamline the development process, our project is built upon a custom-developed, comprehensive Design System. This serves as the central framework for all visual and functional interfaces within our web application.
Importance of the Design System for our Project
A unified design system is essential to the success of our product for the following reasons:
- Consistency: Users can recognize the brand instantly. A cohesive appearance builds trust and conveys professionalism.
- Development Efficiency: By defining reusable components, there is no need to “reinvent the wheel” for every new feature.
- Scalability: New functions can be integrated seamlessly because design rules (layout grids, spacing, colors) are already established.
- Accessibility: By strictly defining contrasts and font sizes, we ensure that the application remains accessible to all target groups.
Core Components of our Style Guide
Color Palette
Our color strategy is deeply rooted in the application's functionality.
- Contextual Derivation: The primary colors and their respective shades were derived directly from metro line branding. This ensures high recognition and creates an immediate visual link to the urban mobility context.
- Color Hierarchy: We utilize a system of primary, secondary, and accent colors, complemented by a grayscale palette for backgrounds and text to effectively manage visual hierarchy.
Typography
- Typographic Scale: We use a fixed scale for font sizes, line heights, and weights.
- Application: This scale is applied consistently across all touchpoints from large headlines for orientation to optimized body text for detailed information. This guarantees a harmonious typographic appearance on all devices.
UI Component Library
A key part of the system is the library of reusable elements:
- Modularity: All elements, such as buttons and input fields, were developed modularly.
- Optimization: Components are specifically optimized for web application requirements (e.g., clear click targets, feedback states like hover or disabled).
- Reusability: Developers can easily access these components, which reduces the margin for error and seamlessly translates the design into the technical implementation.
The Design System forms the visual foundation of our project. It bridges the gap between aesthetic brand identity and technical precision, ensuring that the web application is perceived as a unified, professional, and cohesive piece of work.
Two-Step Marketing Communication Strategy

To build a sustainable brand identity, we are pursuing a two-step communication strategy. The objective is to transition the brand from purely text-based recognition toward iconic symbolic power.
Phase 1: Awareness & Literacy (Initial Phase)
During the launch phase, the focus lies on establishing brand awareness. As the project and the brand are new to Porto’s urban landscape, we will exclusively utilize the full wordmark (full logo).
Implementation: The merged “n” symbol is always presented in combination with the complete “connect” logotype.
Objective: The target audience should develop a cognitive link between the abstract symbol and the brand name. During this stage, commuters “learn” what the symbol represents. Readability is prioritized to eliminate communication barriers.
Phase 2: Iconic Recognition & Symbolism (Establishment Phase)
Once a critical mass of interactions and visual touchpoints has been achieved, the transition to de-branded symbolic communication takes place.
Implementation: The “connect” logotype is removed. The merged “n” stands as a solitary icon—featured on digital screens, projections on platform walls, or physical floor markings within the metro.
Psychological Effect: This step leverages the effect of visual saliency. The symbol has become so deeply embedded in the users' visual memory that the brand name is implicitly associated without being read.
Advantage: Reducing the brand to a pure symbol makes it appear less like traditional advertising and more like an integrated component of the digital art itself. It fosters curiosity and underscores the project’s minimalist, artistic ambition.
4.7. Marketing Programmmes
Whilst the strategy (section 4.6) defines what we aim to achieve, the marketing programme describes how we will put this into practice. This is the translation of our 4Cs into a concrete action plan.
4.7.1 Programmes (Action Plan)
Our marketing programme for the launch of CONNECT and share is divided into three concrete action pillars during a three-month pilot phase:
- Physical Installation (Customer Value & Convenience): In collaboration with engineers from ISEP and Metro do Porto, we are equipping one specific, heavily used metro line (the pilot line) with our sensor-equipped handrails and LED ceilings. This requires no extra effort from passengers, as we are integrating the technology into their existing routine.
- Guerrilla Marketing & Station Promotion (Communication): We avoid traditional, loud advertising. Instead, we place minimalist, intriguing posters, flyers and floor stickers in the metro stations along the pilot line. This arouses curiosity just before passengers board the metro.
- Digital Launch & Storytelling (Phase 2): Activating the QR codes near the metro doors. To encourage adoption, we launch an organic social media campaign (focused on Instagram and TikTok). Here, we will share the most beautiful, most inspiring ‘life lessons’ (messages) left via the QR code anonymously on a weekly basis. This creates a viral, emotional effect (Emotional Branding) and motivates others to share their stories too.
4.7.2 Budget
As CONNECT and share is a social marketing initiative operating within a Business-to-Government (B2G) model, the budget is not funded by the end user, but through public funds, ISEP, grants and Metro do Porto. The estimated costs are based on the list of materials in deliverables. The marketing and operational budget for the pilot phase is allocated as follows:
- R&D and Hardware (Largest cost item): The hardware for a single carriage deployment totals approximately €730 (as detailed in the initial cost analysis, Section 3.3.1). This covers all core components including microcontrollers, enclosures, pressure sensors, LED strips, and supporting electronics.
- Digital Infrastructure: Currently €0. Hosting the Phase 2 web platform via Vercel and Supabase falls within free tiers for a pilot-scale deployment. Should the platform be formally launched or scaled to additional lines, monthly costs are estimated at €50–100 or more.
- Promotional materials: €150–300. Design and printing of guerrilla marketing posters, QR code stickers, and flyers for stations along the pilot line.
- Maintenance & Management (Contingency): Est. 15% of hardware cost (≈€110). A reserved budget for repairs and component replacement.
Estimated total (pilot phase): €1000–1200
4.7.3. Control
To ensure the success of the marketing strategy, a structured monitoring plan is needed. This plan focuses on tracking progress, evaluating effectiveness and making adjustments where necessary. To achieve our marketing goal, the Plan-Do-Check-Act (PDCA) cycle will be used, as illustrated in Figure 25.

The control phase is divided into the following key elements:
Key Performance Indicators (KPIs)
We will measure the impact of the marketing program through four main categories:
- Interaction Rate: Number of activations per handle per hour to measure the physical engagement of the passengers.
- Behavioural Impact: Qualitative and quantitative measurement of the increase in eye contact and reduction of screen time, targeting from 30 to 60 seconds without looking at the phone.
- Content Growth: Number of new anonymous contributions submitted via QR codes, aiming to establish a solid baseline engagement rate during the first 30 days.
- Campaign Reach: Data from QR code scans on posters and flyers to analyze the visibility of the promotion.
- User Satisfaction: Qualitative feedback collected via digital surveys to evaluate their experience.
Continuous Improvement
Following the PDCA cycle shown above, the marketing team will be responsible for keeping an eye on these numbers. If a campaign or a specific poster location doesn't reach enough people, the message or channel will be changed. If the interaction works better than expected, it will be expanded to other metro lines. This constant feedback ensures that the project adapts to the passenger behavior and situational needs in real time.
4.8. Summary
CONNECT functions as more than a technological installation; it is a strategic social marketing intervention designed to enhance urban wellbeing in Porto. By addressing the macro-trend of digital isolation through a stakeholder-centric 4Cs framework, the project delivers superior value while fostering 'Zero-Friction Socialising.' This approach redefines the commute, transforming it into a mindful experience that reinforces Metro do Porto’s identity as a 'Smart City' leader and reclaims the social dimension of the urban environment.
To ensure this impact remains enduring, such social value must be synchronized with environmental and economic responsibility. Consequently, the following chapter details our eco-efficiency measures, exploring how life cycle assessments and circular economy models minimize the project’s ecological footprint while maximizing its potential for sustainable development.