Table of Contents
3. Project Management
This chapter details the project management methodologies and organizational frameworks applied throughout the development of the project. It outlines the team's approach to structuring, executing, and monitoring the workload using an Agile framework organized into 15 distinct sprints.
It covers:
- Scope & Time Management: Definition of the product and project boundaries, alongside schedule management, key milestones, and visual timelines mapping project phases to deadlines.
- Cost & Quality: An overview of the budget allocation, financial tracking (planned versus effective costs), and the quality metrics and thresholds established to evaluate project deliverables.
- People, Stakeholders & Communications: Identification of team roles, responsibilities, stakeholder engagement strategies, and the internal communication channels that guided the group.
- Risk & Procurement: The identification, analysis (quantitative and qualitative), and mitigation of product and project-level risks, alongside sourcing strategies and make-versus-buy decisions.
- Project Plan: A structural breakdown of the project timeline, detailing the Global Sprint Plan, the comprehensive Project Backlog, and the distribution of Epics across the project lifecycle.
- Sprint Outcomes & Evaluations: A review of sprint backlogs, planned capacity versus achieved velocity, and summaries of sprint retrospectives that drove the team's continuous improvement strategy.
3.1. Scope
Defining the scope of CONNECT and share is essential for keeping our efforts focused on the project's objectives: reducing digital isolation and enhancing the passenger experience within the Metro do Porto. By mapping out exactly what is included in the project, we can prevent scope creep and ensure every team member understands the roadmap from conceptualization to final development.
The Work Breakdown Structure (WBS) seen in the Figure 1 ilustrates how we have divided the project into manageable phases and specific deliverables.

3.2. Time
The EPS teams have to complete a list of milestones to ensure project succes. The following Table 1 defines the project timeline, acting as the baseline to monitor the project's performance.
| Date | Description |
|---|---|
| 2026/02/28 | Choose and share the team's top 3 preferred project proposals |
| 2026/03/11 | Upload the “black box” System Diagrams & Structural Drafts |
| 2026/03/18 | Upload the List of Components and Materials (what & quantity) |
| 2026/03/21 | Define the Project Backlog, Global Sprint Plan, Initial Sprint Plan and Release Gantt Chart |
| 2026/03/25 | Upload System Schematics & Structural Drawings to the wiki (Deliverables) and do the cardboard scale model of the structure |
| 2026/04/12 | Upload the Interim Report and Presentation to the wiki (Deliverables) |
| 2026/04/16 | Interim Presentation, Discussion and Peer, Teacher and Supervisor feedbacks |
| 2026/04/22 | Upload 3D model video to Deliverables |
| 2026/04/29 | Upload the final List of Materials (local providers & price, including VAT and transportation) |
| 2026/05/02 | Upload refined Interim Report (based on Teacher & Supervisor Feedback) |
| 2026/05/13 | Upload packaging solution to Deliverables and Report |
| 2026/05/27 | Upload the results of the Functional Tests to the Report |
| 2026/06/13 | Upload the Final Report, Presentation, Video, Paper, Poster and Manual to Deliverables |
| 2026/06/18 | Final Presentation, Individual Discussion and Assessment |
| 2026/06/23 | Update the wiki, report, paper with all suggested corrections. Hand in to the EPS coordinator a printed copy of the poster, brochure and leaflet |
| 2026/06/25 | Demonstration of the operation of the prototype and hand in the prototype and user manual to the client |
The timeline reveals a strong concentration of deliverables in April and May, particularly around the interim report and prototype development phases. This required careful sprint planning to balance documentation and technical implementation tasks.
3.3. Cost
This section details both the anticipated and actual expenditures incurred during the development of the CONNECT and share prototype. Tracking financial performance against initial projections allows the team to detect inefficiencies early, justify spending decisions, and demonstrate fiscal responsibility within the constraints set by the project brief.
3.3.1. Ideal Product Cost
This section outlines the projected costs for a full-scale, production-ready deployment of CONNECT and share across a single metro carriage: 11 handrail nodes, 7 power supply units, and 3 ceiling LED strip runs.
Table 2 presents the planned ideal product hardware costs.
| Component | Type / Model | Qty | Unit Price (€) | Total (€) |
|---|---|---|---|---|
| Microcontroller | Wemos C3 mini (ESP32-C3) | 11 | 6.20 | 68.20 |
| Enclosure | PA Rail (fire-resistant, 3D printed) | 2 | 69.30 | 138.60 |
| Copper tape | Conductive adhesive, 20 mm × 20 m | 15 | 8.86 | 132.90 |
| Velostat | Piezoresistive sheet (pressure sensor) | 15 | 7.90 | 118.50 |
| CAN Transceiver | MCP2551-I/P | 10 | 1.99 | 19.90 |
| LED strip (addressable RGB) | WS2813 IP65, 60 LEDs/m, 1 m | 3 | 30.49 | 91.47 |
| Power supply | DC Step-Down 36–72 V to 12 V, 10 A, 120 W | 6 | 24.67 | 148.02 |
| Wiring, resistors | Miscellaneous passive components | 1 | 10.00 | 10.00 |
| Power supply | (5 V) | 1 | 37.15 | 37.15 |
| Delivery | — | — | — | TBC |
| Total | 764.74 |
Hardware costs per carriage total 764.74 €, with the Polyamide (PA) Rail enclosure being the single most expensive line item at 138.60 € for two units, specified due to its fire-resistance properties required for compliance with metro safety standards. No equivalent Portuguese-based supplier was identified at the time of writing, with the current source located in France. At scale, per-unit hardware costs could be reduced through bulk procurement across multiple carriage deployments.
3.3.2. Prototype Cost
All components were procured through a single supplier (Mauser) to consolidate shipping and avoid duplicate delivery charges. The 3D-printed PLA enclosure was produced using university fabrication facilities, so the line item covers filament material only. Measurement and testing instruments were obtained on loan from the university laboratory, with no associated purchase cost. Table 3 presents total list and pricing of components for the prototype. Planned cost is 2,63 € below budget ceiling (100 €).
| Component | Type / Model | Qty | Unit Price (€) | Total (€) |
|---|---|---|---|---|
| Microcontroller | Wemos C3 mini (ESP32-C3) | 2 | 6.20 | 12.40 |
| Enclosure | PLA biodegradable (3D printed) | 1 | 13.99 | 13.99 |
| CAN bus cable | 2×1.0mm CCA speaker wire, 10m | 1 | 2.20 | 2.20 |
| LED strip diffuser | Opaque sliding diffuser for aluminium profile, 2m | 1 | 3.27 | 3.27 |
| Potentiometer | 10 kΩ linear mono | 1 | 0.49 | 0.49 |
| Copper tape | Conductive adhesive, 50 mm × 20 m | 1 | 17.60 | 17.60 |
| Velostat | Piezoresistive sheet (pressure sensor) | 2 | 7.90 | 15.80 |
| CAN Transceiver | MCP2551-I/P | 2 | 1.99 | 3.98 |
| LED strip (addressable RGB) | WS2813 IP65, 60 LEDs/m, 2m | 1 | 11.27 | 11.27 |
| Barrel jack adapter | DC female 5.5×2.1mm screw terminal | 1 | 0.92 | 0.92 |
| Power supply | 5 VDC 4 A 20 W, 5.5×2.1mm | 1 | 11.75 | 11.75 |
| Jumper cables | 120-piece Dupont set M-M/M-F/F-F, 200mm | 1 | 3.20 | 3.20 |
| Resistors | Metal film 1 kΩ 0.6 W | 10 | 0.05 | 0.50 |
| Total | 97.37 |
3.4. Quality
Quality management is needed to ensure that every deliverable meets the technical requirements and the expectations of our primary stakeholders: Porto Metro passengers and EPS coordination. Following the Project Management Body of Knowledge (PMBOK) standards, quality is managed as a continuous process rather than a final check. By defining clear metrics and verification protocols, we minimize risks and guarantee that the final prototype is safe, functional and socially impactful.
3.4.1 Quality Requirements and Metrics
To quantify the success of our work, we have established specific metrics and acceptance thresholds. As seen in Table 4 each deliverable is associated with a measurable requirement. The selected quality metrics focus on three dimensions: technical functionality, user experience, and project completeness. This ensures that CONNECT and share is not only operational, but also meaningful and usable in its intended social context.
| WP | Deliverable (WBS) | Requirement | Quality Metric | Threshold (Acceptance) |
|---|---|---|---|---|
| 1. Management | 1.1 WBS | Organize tasks | Complete list of deliverables | All mandatory deliverables included |
| 1.2 Gantt Chart | Control deadlines | Approved schedule | Finalized timeline | |
| 1.3 Global Sprint Plan | Plan sprints | Sprint dates | Approved sprint plan | |
| 1.4 Weekly Sprint Plan | Weekly tracking | Weekly version | Updated weekly plan | |
| 1.5 Product Backlog | Distribute workload | Jira | All active sprint tasks assigned | |
| 1.6 Stakeholder Management | Identify key people | Stakeholder map | Closed list of stakeholders | |
| 1.7 Risk Managemet Plan | Prevent issues | Response plan | Critical risks under control | |
| 2. Research | 2.1 State of the Art | Learn from others | Market analysis | Similar solutions reviewed |
| 2.2 Ethics | Comply with the law | Ethics report | Standards met | |
| 2.3 Sustainability | Environmental care | Environmental report | Materials analyzed | |
| 3. Design | 3.1 Structural Drawings | Assembly clarity | Final version of drawings | Approved blueprints |
| 3.2 Black Box Diagram | Define connections | Block diagram | Error-free logic flow | |
| 3.3 Detailed Schematics | Circuit design | Electronic schematic | Finished and reviewed drawing | |
| 3.4 Prototype (CAD) | 3D Design | Final digital model | Components fit correctly | |
| 3.5 Packaging | Casing protection | Casing material | > 95% recyclable material | |
| 3.6 Cardboard Model | Physical 3D “twin” | Real-scale model | Design matches 3D model | |
| 4. Development | 4.1 List of Materials | Control spending | Final budget | Max. 100 € total cost |
| 4.2 Code | System programming | Correct operation | Code runs without error | |
| 4.3 Simulations | PC Testing | On-screen results | Approved simulation | |
| 4.4 QR APP | Create the link | QR Functionality | QR code works correctly | |
| 5. Marketing | 5.1 Flyer | Create brochure | Visual appeal | Professional, non-pixelated design |
| 5.2 Leaflet | Explain the project | Message clarity | Passengers understand it instantly | |
| 5.3 Poster | Design poster | Impact on the Metro | Visible colors and CONNECT and share logo | |
| 5.4 Marketing Video | Record promotion | Promo quality | Fluid image and engaging message | |
| 5.5 3D Model Video | Show the interior | Technical fidelity | Internal mechanism is clearly visible | |
| 6. Testing | 6.1 Functional Tests | Test operation | Test results | System is fully functional |
| 6.2 User Interaction | Test with people | User opinion | Positive user feedback | |
| 6.3 KPI Definition | Set goals | Success definition | Project targets fixed | |
| 6.4 Data Analysis | Analyze results | Data charts | Analyzed and clear data | |
| 7. Reporting | 7.1 Interim Report | Mid-term report | Wiki chapters | Approved draft |
| 7.2 Interim Pres. | Present progress | PowerPoint presentation | Presentation performed | |
| 7.3 Final Report | Final report | Final Wiki document | All required chapters finalized | |
| 7.4 Final Pres. | Final defense | Project defense | Final presentation performed | |
| 7.5 Paper | Write article | Paper format | Finished article | |
| 7.6 Manual | User guide | Instructions for use | Easy-to-follow guide |
To quantify the success of our work at the product level, we have established specific metrics and acceptance thresholds for the physical and digital architecture of CONNECT and share. As seen in Table 5, each technical subsystem and deliverable is associated with a measurable requirement. The selected quality metrics focus on three dimensions: hardware stability, network communication, and software performance. This ensures that the CONNECT and share prototype is not only operationally sound under railway simulation constraints but also structurally safe and robust for real-world user interaction.
| WP | Deliverable (WBS) | Requirement | Quality Metric | Threshold (Acceptance) |
|---|---|---|---|---|
| 3. Design | 3.1 Main Ceiling Housing | Anchoring and PCB protection | Geometric dimensional accuracy | Physical parts stay within ± 1 mm of CAD model |
| 3.2 Pole Secondary Node | Isolate internal components | Localized structural tension | Stress below 10% of yield strength under 100N load | |
| 3.3 Enclosure Materials | Comply with railway fire safety | Flammability certification | V-0 (UL94) / LSHF compliance under EN 45545-2 | |
| 4. Development | 4.1 Central Node PCB | Regulate node power supply | Voltage stability under full load | Output voltage stays at 5.0 V ± 0.1 V |
| 4.2 Sensor Node PCB | Condition Velostat input | Analog baseline voltage | Absolute 0 V baseline with stable 2.2 kΩ pull-down | |
| 4.3 LED Strip Array | Drive digital lighting array | Signal noise margin (VIH) | Amplitude ≥ 3.5 V to prevent data line flickering | |
| 4.4 CAN Bus Network | Broker distributed node data | Packet Delivery Ratio (PDR) | ≥ 99.9% frame delivery over 1000 messages | |
| 4.5 Interaction Firmware | Implement low-power states | Standby current consumption | Current draw dropped below < 15 mA in deep-sleep | |
| 4.6 QR Web Application | Scale message database | API route failure rate | 0.0% error rate under 1000 concurrent write requests | |
| 4.7 AI Moderation Layer | Filter toxic text entries | Content approval classification | 100% rejection of harmful or offensive strings | |
| 6. Testing | 6.1 System Response Time | Real-time ambient animation | Processing & propagation delay | Total latency from touch to light pulse < 100 ms |
| 6.2 Ergonomic Usability | Ensure universal accessibility | Interaction intuitive rate | ≥ 80% of users trigger the system in ≤ 5 seconds | |
| 6.3 System Usability Scale | Validate user experience (UX) | Standardized 10-item questionnaire | Mean SUS score higher than the industry average (> 68) |
3.4.2 Verification Sheets
While metrics define “what” we want to achieve, our verification system ensures “how” we check it. Table 6 presents a series of Yes/No questions for every deliverable. These sheets act as a final quality gate: if the answer to the question is “Yes”, the deliverable is accepted.
| WP | Deliverable (WBS) | Necessary Steps (Checklist) |
|---|---|---|
| 1. Management | 1.1 WBS | Map 100% of the 35 mandatory EPS deliverables inside the work breakdown hierarchy. |
| 1.2 Gantt Chart | Ensure the project baseline duration variance stays strictly below 5% on critical paths. | |
| 1.3 Global Sprint | Define and align 100% of the milestone timelines across the sprints. | |
| 1.4 Weekly Sprint | Update real task progress logs in Jira every Thursday. | |
| 1.5 Product Backlog | Verify that $\geq 95\%$ of all active Jira tasks have an owner and a Story Point estimate assigned before sprint activation. | |
| 1.6 Stakeholders | Complete the communication mapping matrix for 100% of the identified stakeholder groups. | |
| 1.7 Risk Mgmt | Allocate a dedicated mitigation or avoidance action plan for 100% of high-exposure risks (Score $\geq 60$). | |
| 2. Research | 2.1 State of Art | Complete a detailed competitive benchmarking study analyzing $\geq 3$ similar market solutions. |
| 2.2 Ethics | Enforce a zero-data collection architecture to ensure 100% GDPR compliance with 0 bytes of personal data stored. | |
| 2.3 Sustainability | Ensure $\geq 80\%$ of the structural deployment design specifies sustainable or circular materials (Cork / PA Rail). | |
| 3. Design | 3.1 Structural | Finalize CAD assembly drawings including complete physical measurement annotations and $\pm 1$ mm clearances. |
| 3.2 Black Box | Close 100% of data network signals, integrating hardware timeouts and error-handling loops for open nodes. | |
| 3.3 Schematics | Validate the design circuit with 0 short-circuit flags and maintain $\geq 5$ mm trace separation between voltage rails. | |
| 3.4 Prototype (CAD) | Run spatial interference check to verify 0 mm volumetric overlapping between embedded electronic PCBs and the enclosure. | |
| 3.5 Packaging | Construct a 100% monomaterial, 100% recyclable cork housing that can sustain a physical load $\geq 100$ kg. | |
| 3.6 Cardboard | Complete a 1:1 scale physical ergonomics mock-up and secure formal approval by a unanimous team review. | |
| 4. Development | 4.1 List Materials | Limit total prototype materials and shipping expenditure to stay strictly under the €100 project cap. |
| 4.2 Code | Log 0 memory leaks, stack overflows, or software lockups during a continuous 24-hour runtime simulation. | |
| 4.3 Simulations | Achieve a localized structural safety factor $> 2.0$ against the yield limit of the housing material under FEA load states. | |
| 4.4 QR APP | Validate that 100% of scanned quick response paths trigger immediate HTTP 200 routing to the production landing URL. | |
| 5. Marketing | 5.1 Flyer | Verify that all visual assets are exported with a professional graphic density of at least 300 DPI. |
| 5.2 Leaflet | Measure that non-technical testers can decode the core CONNECT and share value proposition within $< 10$ seconds. | |
| 5.3 Poster | Ensure the corporate CONNECT and share logo identity remains perfectly legible from a physical distance of at least 3 meters. | |
| 5.4 Marketing Video | Render a full high-definition video track (1080p @ 60fps) with audio levels normalized strictly to -14 LUFS. | |
| 5.5 3D Video | Display 100% of internal mechanism structures, including PCB positioning and internal CAN Bus network pathways. | |
| 6. Testing | 6.1 Functional | Measure a Packet Delivery Ratio (PDR) $> 99.9\%$ across the serial communication bus under 1000 iterative data frames. |
| 6.2 User Test | Achieve an excellent mean usability score $> 68$ using the standardized 10-item System Usability Scale (SUS) ($n = 11$). | |
| 6.3 KPI Def. | Quantify 100% of success metrics with distinct mathematical limits, eliminating descriptive, non-measurable targets. | |
| 6.4 Data Analysis | Plot 100% of test result graphs with explicit variance indicators, mean standard deviations, or error bars. | |
| 7. Reporting | 7.1 Interim Report | Deliver 100% of mid-term Wiki chapters completely filled with 0 empty pages before the academic deadline. |
| 7.2 Interim Pres. | Format the speech presentation structure to fit strictly within the 15-minute allocation window ($\pm 30$ seconds). | |
| 7.3 Final Report | Execute automated spell-check and peer review to ensure 0 linguistic errors and 100% compliance with standard SI formatting. | |
| 7.4 Final Pres. | Ensure 0 hardware resets, connection dropouts, or power failures occur during the live presentation demo. | |
| 7.5 Paper | Verify 100% structural layout compliance against the mandatory IEEE / academic conference publishing template. | |
| 7.6 Manual | Measure a success rate $> 90\%$ for independent, non-technical users attempting to operate the system using the step-by-step instructions. |
Similarly, to verify the physical and digital architecture of the product without repeating project management milestones, Table 7 provides the specific verification checklist for the technical deliverables of CONNECT and share. These product-level questions serve as the final engineering gate before hardware deployment.
| WP | Deliverable (WBS) | Necessary Steps (Checklist) |
|---|---|---|
| 3. Design | 3.1 Main Ceiling Housing | Do all physical fabrication dimensions of the printed enclosure stay within a ± 1 mm tolerance band when measured against the Fusion 360 CAD model? |
| 3.2 Pole Secondary Node | Does the localized structural tension remain below 10% of the material yield strength under a 100 N distributed load during SimScale FEA testing? | |
| 3.3 Enclosure Materials | Do the structural housing compounds and internal wire insulation layers carry official V-0 (UL94) flammability or LSHF certifications under standard EN 45545-2? | |
| 4. Development | 4.1 Central Node PCB | Does the output voltage of the central node power rail maintain a stable 5.0 V ± 0.1 V output under a continuous 100% white LED brightness load? |
| 4.2 Sensor Node PCB | Does the analog sensor conditioning circuit maintain an absolute 0.00 V baseline on the ESP32 ADC pin when the Velostat grip is completely idle? | |
| 4.3 LED Strip Array | Does the digital data line driven by the MCU reach a signal amplitude high enough (VIH ≥ 3.5 V) to completely eliminate high-frequency pixel flickering? | |
| 4.4 CAN Bus Network | Does the communication interface achieve a Packet Delivery Ratio (PDR) ≥ 99.9% when transmitting 1000 consecutive data frames under simulated engine EMI? | |
| 4.5 Interaction Firmware | Does the standby electrical current consumption of the distributed nodes drop below < 15 mA during interrupt-driven deep-sleep states? | |
| 4.6 QR Web Application | Does the production database API route achieve a 0.0% failure rate when subjected to a heavy load test of 1000 concurrent write operations? | |
| 4.7 AI Moderation Layer | Does the server backend automatically reject 100% of toxic, harmful, or offensive message strings with an immediate HTTP 400 bad request error? | |
| 6. Testing | 6.1 System Response Time | Is the total end-to-end delay between the physical touch contact and the visual LED trail ignition strictly under < 100 ms when analyzed at 240 FPS? |
| 6.2 Ergonomic Usability | Do ≥ 80% of non-technical sample passengers instinctively locate and successfully trigger the handrail interaction area in ≤ 5 seconds? | |
| 6.3 System Usability Scale | Does the final calculated mean score from the 10-item System Usability Scale (SUS) survey sit comfortably above the industry baseline (> 68)? |
3.5. People & Stakeholder Management
To make CONNECT and share and share a success, it is necessary to strategically manage all parties affected by the project. Following the PMBOK standards, this section identifies the key individuals and groups, defines their roles and outlines the management strategy.
3.5.1. Project Team and Internal Dynamics
We operate under a structure where all members share responsibility for project management. However, as we are a team of students with diverse backgrounds, special tasks are delegated based on individual expertise.
Using the weekly sprint plan helps us to redistribute tasks if a member is overburdened to prevent burnout and ensure quality.
3.5.2. Stakeholders Identification and Roles
Apart from the main teams, several external entities are involved in the project. In the Table 8 below, we identified them, their roles and their responsibilities.
| Entity / Name | Project Role | Primary Responsibility |
|---|---|---|
| Team Members | Project owners | Responsible for the full development cycle and all mandatory deliverables. |
| Coaches | EPS Supervisors | Supervise, evaluate progress, and provide strategic feedback. |
| ISEP Faculty | Advisors | Offer specialized knowledge in Electronics, Sustainability, Project Management, Ethics, Marketing, among others. |
| ISEP | Main sponsor | Provides infrastructure and funding for the components (BOM). |
| Metro do Porto | External client | Provides the operational context and establishes security and infrastructure standards. |
| Security Department (Metro) | Regulatory body | Validates that the handle complies with fire, electrical, and physical safety regulations. |
| Metro do Porto Users | Target group | Live the CONNECT and share experience during their commutes and provide feedback. |
| Suppliers | Suppliers | Responsible for the timely delivery of components. |
| Legal | Regulatory compliance | Guarantees that the QR app and data management comply with European regulations. |
| Maintenance Team (Metro) | Operational stakeholder | Evaluates ease of installation, durability, and maintenance of the smart handle. |
| Cleaning Staff (Metro) | Operational support | Provides hygiene, accessibility, and resistance of the materials. |
Among all stakeholders, Metro do Porto, the Security Department (Metro), and end users are considered critical, as they directly influence feasibility, approval, and user acceptance.
3.5.3. Stakeholders Management Strategy
To manage these relationships effectively, we have analyzed each stakeholder based on their Power and Interest. This analysis allows us to prioritize our communication and engagement efforts.
A) POWER/INTEREST MATRIX
The following matrix, seen in the Figure 2, categorizes our stakeholders into four quadrants to determine the necessary level of engagement for each group.

B) ENGAGEMENT STRATEGY TABLE
While the matrix identifies the “where”, the following Table 9 defines the “how”. It establishes the specific strategy for each group and assigns a point person from the internal team to manage the relationship.
| ID | Stakeholder Group | Quadrant | Management Strategy | Point Person |
|---|---|---|---|---|
| 1 | Team Members | Manage Closely | Daily collaboration, stand-up meetings, and shared decision-making | All Members |
| 2 | Metro do Porto | Manage Closely | Continuous alignment with their operational context and branding requirements | Management Lead |
| 3 | Security Department | Manage Closely | Strict adherence to fire and electrical safety rules to ensure final approval | Technical Lead |
| 4 | Maintenance Team | Keep Satisfied | Ensure the design is durable and provide a clear installation manual | Hardware Lead |
| 5 | Coaches | Keep Satisfied | Weekly progress reports, Wiki updates, and formal meetings | Management Lead |
| 6 | ISEP (Sponsor) | Keep Satisfied | Compliance with budget (BOM) and laboratory facility usage rules | Management Lead |
| 7 | Metro Users | Keep Informed | Gather feedback through surveys and haptic testing to improve the UX | Marketing Lead |
| 8 | ISEP Faculty | Keep Informed | Consulting on technical challenges (Electronics, CAD, and Marketing) | Technical Lead |
| 9 | Legal | Keep Informed | Ensure all digital interactions and data handling follow EU regulations | Legal Lead |
| 10 | Suppliers | Monitor | Tracking component availability and lead times for hardware integration | Hardware Lead |
| 11 | Cleaning Staff | Monitor | Selecting materials that resist the Metro's chemical cleaning protocols | Hardware Lead |
3.6. Communications
To ensure CONNECT and share's success, communication is key. A communication strategy has been established to guarantee alignment between team members, supervisors and stakeholders.
3.6.1. Communication Channels and Tools
The team uses multiple tools to maintain a continuous flow of information:
- WhatsApp: Used for urgent, informal and daily communication.
- Microsoft Teams: Serves as the primary repository for all project documentation. Also for remote meetings.
- Jira: Used to track the backlog, manage sprints and assign tasks to team members.
- Miro: A digital whiteboard used during brainstorming sessions.
- Outlook: Reserved for formal communication with external stakeholders, suppliers and ISEP coordinators.
3.6.2. Communication Matrix
Table 10 presents our activities and the way of realization, covering the frequency, medium, and participants involved in each communication event throughout the project.
| Activity | Objective | Frequency | Medium | Participants |
| Daily Stand-up | Daily tasks and identify blockers. | Daily | WhatsApp / Face-to-Face | Team Members |
| Weekly Meeting | Review weekly progress and plan next Sprint. | Every Thursday | Face-to-Face | Team & Supervisors |
| Sprint Planning | Define tasks and goals for the next cycle. | Weekly | Jira | Team Members |
| Retrospective | Evaluate team performance and workflow. | Weekly | Face-to-Face | Team Members |
| Interim Demo | Present project status to coordinators. | Milestone-based | Presentation | Team & Supervisors |
3.6.3. Stakeholder Management
We maintain a specific communication frequency with external parties:
- ISEP Supervisors: Weekly feedback sessions every Thursday to ensure the project meets academic requirements.
- Target Users: Feedback gathered through surveys and testing sessions.
3.7. Risk
Risk management for CONNECT and share involves a systematic approach to identify and address potential challenges. Following the PMBOK standards, we have performed qualitative analyses to ensure that risks are treated effectively.
3.7.1. Identification of Key Risks
We have identified the following risks categorized into project and product levels.
PROJECT LEVEL RISKS:
- Delivery: Delays in receiving components
- Financial Constraint: Exceeding the budget due to component value or price fluctuations
- Team Synchronicity: misalignment in tasks leading to delays in the final assembly
PRODUCT LEVEL RISKS:
- Safety Rejection: Failure to meet safety standards
- Vandalism: Intentional damage or theft of the internal electronics
- Environmental Durability: Material degradation
- Cybersecurity: QR code spoofing
- Power Supply Instability: Failure of the internal battery or power management system during long commutes
- Ergonomic Strain: The handle design causing discomfort or safety issues for passengers
- Privacy Breach: Unauthorized collection or exposure of user data through the interaction app.
3.7.2. Qualitative and Quantitative Evaluation
To evaluate these risks, we adopt a 5×5 Risk Matrix seen on the Figure 3. The exposure score is calculated by multiplying Probability (1-5) and Impact (1-5).
Probability Scale: 1 (Rare) to 5 (Almost Certain)
Impact Scale: 1 (Insignificant) to 5 (Severe)
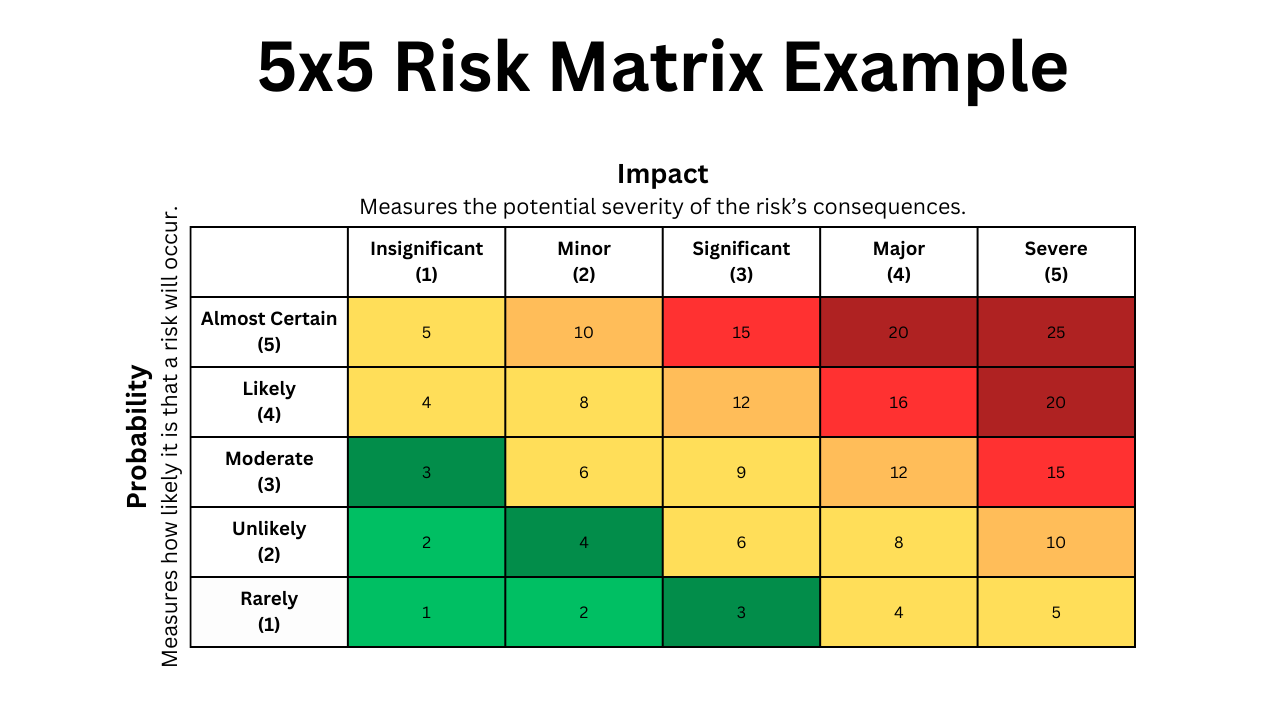
EXPOSURE LEVELS:
- Low (1-3): Acceptable; minimal monitoring.
- Moderate (4-6): Manageable; requires routine control.
- High (8-12): Significant; requires a specific mitigation plan.
- Extreme (15-25): Critical; requires immediate action and response.
3.7.3. Risk Analysis, Handling, and Monitoring Table
The risk analysis highlights that logistical and physical risks (delivery and vandalism) pose the greatest threat to project success, like it is shown in Figure 11.
| ID | Risk Description | Probability | Impact | Score | Response | Management (Action) | Follow-up |
|---|---|---|---|---|---|---|---|
| R1 | Delivery (Component delays) | 4 | 4 | 16 | Avoid | Purchase from local suppliers as soon as possible. | Weekly tracking of shipment ID. |
| R2 | Financial Constraint (Budget) | 3 | 4 | 12 | Mitigate | Use recycled materials for non-critical parts. | Bi-weekly review of expense log. |
| R3 | Team Synchronicity | 3 | 3 | 9 | Mitigate | Maintain open communication and shared task boards. | Weekly stand-up progress checks. |
| R4 | Safety Rejection (Metro) | 2 | 5 | 10 | Avoid | Strictly follow the Porto Metro technical manuals. | Regular design reviews with coaches. |
| R5 | Vandalism | 3 | 4 | 12 | Mitigate | Use tamper-proof screws and a robust housing. | Physical integrity testing. |
| R6 | Environmental Durability | 2 | 4 | 8 | Mitigate | Select chemical-resistant polymers for the housing. | Cleaning agent exposure tests. |
| R7 | Cybersecurity | 2 | 4 | 8 | Avoid | Implement encryption and secure QR protocols. | Firmware penetration testing. |
| R8 | Power Supply Instability | 3 | 3 | 9 | Reduce | Implement deep sleep modes in the ESP32 code. | Log power consumption. |
| R9 | Ergonomic Strain | 2 | 3 | 6 | Reduce | Create several 3D-printed prototypes for testing. | User feedback surveys. |
| R10 | Privacy Breach | 1 | 5 | 5 | Avoid | No personal data is collected via the application. | Legal checklist verification. |
3.7.4. Definition of Appropriate Risk Responses
Based on the results, our strategy prioritizes Extreme and High risks. Delivery (R1) and Vandalism (R5) require immediate mitigation through early procurement and robust mechanical design.
For safety and privacy risks (R4, R10) and avoidance strategy is mandatory. We ensure the project is never at risk of legal or institutional rejection by following external regulations.
All secondary risks are monitored through iterative testing to detect any score escalation.
3.8. Procurement
The CONNECT and share procurement strategy balances regulated industrial components with cost-effective prototyping through centralized purchasing and institutional resource utilization. All components are sourced with a primary supplier and a defined fallback to ensure prototype assembly is not blocked by availability issues.
3.8.1. Sources
Three procurement streams are defined:
- Primary Hardware (Buy): Electronic components including microcontrollers (Wemos C3 Mini), WS2813 LED strips, MCP2551 CAN transceivers, and resistors are sourced from Mauser.pt, chosen for its Portuguese presence, competitive pricing, and reliable lead times. In the event Mauser.pt cannot fulfill an order, the fallback suppliers are Mouser Electronics (mouser.com) and Worten (worten.pt), both of which stock equivalent or pin-compatible parts and ship to Portugal within 3 to 5 business days.
- Specialty Materials (Buy): Nanovia PA Rail filament is procured directly from the manufacturer, as it is the only identified EN 45545-2 compliant fire-retardant filament certified for metro rail applications. No equivalent Portuguese supplier exists. Should Nanovia be unavailable or delivery be delayed, the fallback is Polymaker PC-FR or BASF Ultrafuse FR filament, which carry comparable fire-retardancy ratings and are available through 3DJake.com or Filamento.pt with shorter regional lead times.
- Fabrication (Make): Enclosures are 3D printed using ISEP laboratory facilities, reducing cost to raw material only. If ISEP printers are unavailable, a local print service such as Fablab Porto or an online service such as Craftcloud can produce parts from supplied STL files within 2 to 4 days.
3.8.2. Make vs. Buy Decisions
The following Table 12 summarizes the strategic choices for key project elements.
| Item | Decision | Rationale |
|---|---|---|
| Electronic Nodes | Buy | Wemos C3 Mini boards offer greater reliability and lower cost than custom PCBs at prototype stage. |
| Enclosures | Make | 3D printing enables rapid design iteration and custom fit to metro handrail geometry. |
| Sensing Material | Buy | Velostat is a specialized piezoresistive material with no viable in-house alternative. |
| Web Platform | Make | Custom React/Supabase implementation ensures delayed-gratification logic and anonymization requirements are precisely met. |
3.8.3. Cost and Schedule Control
Expenditure is tracked against a detailed bill of materials within the program budget constraints. Component procurement is milestone-gated to ensure availability before prototype assembly begins. For each line item, the primary supplier, unit price, and quantity required are recorded in the BOM alongside the identified fallback supplier and its estimated lead time differential. Miscellaneous passive components are sourced locally where possible to reduce lead times. If a primary supplier quotes a lead time exceeding five business days at a critical milestone, the fallback supplier is activated without waiting for the primary order to fail.), both of which stock equivalent or pin-compatible parts and ship to Portugal within 3 to 5 business days.
- Specialty Materials (Buy): Nanovia PA Rail filament is procured directly from the manufacturer, as it is the only identified EN 45545-2 compliant fire-retardant filament certified for metro rail applications. No equivalent Portuguese supplier exists. Should Nanovia be unavailable or delivery be delayed, the fallback is Polymaker PC-FR or BASF Ultrafuse FR filament, which carry comparable fire-retardancy ratings and are available through 3DJake.com or Filamento.pt with shorter regional lead times.
- Fabrication (Make): Enclosures are 3D printed using ISEP laboratory facilities, reducing cost to raw material only. If ISEP printers are unavailable, a local print service such as Fablab Porto or an online service such as Craftcloud can produce parts from supplied STL files within 2 to 4 days.
3.9. Project Plan
As detailed in the Global Sprint Plan (see 13), the project is divided into 15 distinct sprints.
| Sprint | Start | Finish | Working days |
|---|---|---|---|
| 1 | 5 march | 12 march | 4 days of availability |
| 2 | 12 march | 19 march | 5 days of availability |
| 3 | 19 march | 26 march | 5 days of availability |
| 4 | 26 march | 2 april | 5 days of availability |
| 5 | 2 april | 16 april | 2 days of availability |
| 6 | 16 april | 23 april | 5 days of availability |
| 7 | 23 april | 30 april | 5 days of availability |
| 8 | 30 april | 14 may | 4 day of availability |
| 9 | 14 may | 21 may | 5 days of availability |
| 10 | 21 may | 28 may | 5 days of availability |
| 11 | 28 may | 4 june | 5 days of availability |
| 12 | 4 june | 11 june | 5 days of availability |
| 13 | 11 june | 18 june | 5 days of availability |
The specific tasks and deliverables assigned to these periods are managed in the Project Backlog (see Table 14).
| Timeline | Epic | Ticket code | Ticket title | Status |
|---|---|---|---|---|
| Sprint 1 (5 Mar - 12 Mar) | General / No Epic | SCRUM-3 | Communication presentation | Done |
| Sprint 1 (5 Mar - 12 Mar) | INITIATION & PLANNING | SCRUM-74 | Ideation discussion | Done |
| Sprint 1 (5 Mar - 12 Mar) | SYSTEM DESIGN & DRAWINGS | SCRUM-2 | Blackbox diagram | Done |
| Sprint 1 (5 Mar - 12 Mar) | SYSTEM DESIGN & DRAWINGS | SCRUM-21 | Drawings | Done |
| Sprint 1 (5 Mar - 12 Mar) | SYSTEM DESIGN & DRAWINGS | SCRUM-48 | Structural Drafts | Done |
| Sprint 2 (12 Mar - 19 Mar) | FINAL DELIVERABLES | SCRUM-26 | Flyer | Done |
| Sprint 2 (12 Mar - 19 Mar) | General / No Epic | SCRUM-75 | Selection of Materials & Components V2 | In Progress |
| Sprint 2 (12 Mar - 19 Mar) | General / No Epic | SCRUM-76 | Presentation for Teachers | Done |
| Sprint 2 (12 Mar - 19 Mar) | INITIATION & PLANNING | SCRUM-42 | Backlog, Gantt and Sprint Plan | Done |
| Sprint 2 (12 Mar - 19 Mar) | INTERIM REPORT-WIKI CONTENT | SCRUM-55 | Background and Related Work | In Progress |
| Sprint 2 (12 Mar - 19 Mar) | INTERIM REPORT-WIKI CONTENT | SCRUM-57 | Marketing Plan | In Progress |
| Sprint 2 (12 Mar - 19 Mar) | INTERIM REPORT-WIKI CONTENT | SCRUM-58 | Eco-Efficiency Measures for Sustainability | In Progress |
| Sprint 2 (12 Mar - 19 Mar) | INTERIM REPORT-WIKI CONTENT | SCRUM-73 | Canvas | Done |
| Sprint 2 (12 Mar - 19 Mar) | INTERIM REPORT-WIKI CONTENT | SCRUM-79 | 4.1 Introduction | To Do |
| Sprint 2 (12 Mar - 19 Mar) | INTERIM REPORT-WIKI CONTENT | SCRUM-80 | 4.2 Business Idea Formulation | To Do |
| Sprint 2 (12 Mar - 19 Mar) | INTERIM REPORT-WIKI CONTENT | SCRUM-81 | 4.3 Business Model | To Do |
| Sprint 2 (12 Mar - 19 Mar) | INTERIM REPORT-WIKI CONTENT | SCRUM-82 | 4.4 Market Analysis | To Do |
| Sprint 2 (12 Mar - 19 Mar) | INTERIM REPORT-WIKI CONTENT | SCRUM-83 | 4.5 SWOT Analysis | To Do |
| Sprint 2 (12 Mar - 19 Mar) | INTERIM REPORT-WIKI CONTENT | SCRUM-84 | 4.6 Strategy | To Do |
| Sprint 2 (12 Mar - 19 Mar) | INTERIM REPORT-WIKI CONTENT | SCRUM-85 | 4.7 Marketing Programs | To Do |
| Sprint 2 (12 Mar - 19 Mar) | INTERIM REPORT-WIKI CONTENT | SCRUM-86 | 4.8 Conclusion | To Do |
| Sprint 2 (12 Mar - 19 Mar) | SYSTEM DESIGN & DRAWINGS | SCRUM-49 | Selection of Materials & Components v1 | Done |
| Sprint 2 (12 Mar - 19 Mar) | SYSTEM DESIGN & DRAWINGS | SCRUM-50 | Name and Logo | Done |
| Sprint 3 (19 Mar - 26 Mar) | General / No Epic | SCRUM-77 | Ethics Scandal PowerPoint | To Do |
| Sprint 3 (19 Mar - 26 Mar) | SYSTEM DESIGN & DRAWINGS | SCRUM-51 | Detailed Schematics | To Do |
| Sprint 3 (19 Mar - 26 Mar) | SYSTEM DESIGN & DRAWINGS | SCRUM-52 | Structural Drawings | To Do |
| Sprint 3 (19 Mar - 26 Mar) | SYSTEM DESIGN & DRAWINGS | SCRUM-53 | Cardboard Model | To Do |
| Backlog | CLOSING | SCRUM-63 | Update Wiki & MS Teams (Final Deliverables) | To Do |
| Backlog | FINAL DELIVERABLES | SCRUM-20 | Final List of Materials & Components | To Do |
| Backlog | FINAL DELIVERABLES | SCRUM-23 | Code | To Do |
| Backlog | FINAL DELIVERABLES | SCRUM-24 | 3D Model Video | To Do |
| Backlog | FINAL DELIVERABLES | SCRUM-25 | Flyer | Done |
| Backlog | FINAL DELIVERABLES | SCRUM-27 | Packaging Solution | To Do |
| Backlog | FINAL DELIVERABLES | SCRUM-28 | Manual | To Do |
| Backlog | FINAL DELIVERABLES | SCRUM-29 | Simulations | To Do |
| Backlog | FINAL DELIVERABLES | SCRUM-32 | Final Report | To Do |
| Backlog | FINAL DELIVERABLES | SCRUM-33 | Final Presentation | To Do |
| Backlog | FINAL DELIVERABLES | SCRUM-34 | Paper | To Do |
| Backlog | FINAL DELIVERABLES | SCRUM-35 | Poster | To Do |
| Backlog | FINAL DELIVERABLES | SCRUM-36 | Video | To Do |
| Backlog | FINAL DELIVERABLES | SCRUM-62 | Selection of Local Providers | To Do |
| Backlog | General / No Epic | SCRUM-30 | Interim Report | To Do |
| Backlog | INTERIM REPORT-WIKI CONTENT | SCRUM-54 | Introduction | To Do |
| Backlog | INTERIM REPORT-WIKI CONTENT | SCRUM-56 | Project Management | To Do |
| Backlog | INTERIM REPORT-WIKI CONTENT | SCRUM-59 | Ethical and Deontological Concerns | To Do |
| Backlog | INTERIM REPORT-WIKI CONTENT | SCRUM-60 | Project Developments | To Do |
| Backlog | INTERIM REPORT-WIKI CONTENT | SCRUM-61 | Conclusions | To Do |
| Backlog | PROTOTYPE DEVELOPMENT | SCRUM-69 | Figma Designs for Message Application | To Do |
| Backlog | PROTOTYPE DEVELOPMENT | SCRUM-78 | Message Application code | To Do |
| Backlog | TESTING | SCRUM-66 | Functional testing | To Do |
| Backlog | TESTING | SCRUM-67 | Non-functional testing | To Do |
| Backlog | TESTING | SCRUM-68 | User-acceptance testing | To Do |
The high-level distribution of Epic responsibilities across the timeline is summarized in the Initial Sprint Plan (see Table15).
| Sprint | Start | Finish | Epics | Responsible |
|---|---|---|---|---|
| 1 | 5 march | 12 march | INITIATION & PLANNING | All |
| 2 | 12 march | 19 march | INITIATION & PLANNING; SYSTEM DESIGN & DRAWINGS; FINAL DELIVERABLES | All |
| 3 | 19 march | 26 march | INITIATION & PLANNING; SYSTEM DESIGN & DRAWINGS | All |
| 4 | 26 march | 2 april | SYSTEM DESIGN & DRAWINGS; INTERIM REPORT & PRESENTATION | All |
| 5 | 2 april | 9 april | INTERIM REPORT & PRESENTATION | All |
| 6 | 9 april | 16 april | PROTOTYPE CONSTRUCTION; FINAL DELIVERABLES | All |
| 7 | 16 april | 23 april | PROTOTYPE CONSTRUCTION; FINAL DELIVERABLES | All |
| 8 | 23 april | 30 april | PROTOTYPE CONSTRUCTION; FINAL DELIVERABLES | All |
| 9 | 30 april | 7 may | PROTOTYPE CONSTRUCTION; FINAL DELIVERABLES | All |
| 10 | 7 may | 14 may | PROTOTYPE CONSTRUCTION; FINAL DELIVERABLES | All |
| 11 | 14 may | 21 may | PROTOTYPE CONSTRUCTION; FINAL DELIVERABLES | All |
| 12 | 21 may | 28 may | PROTOTYPE CONSTRUCTION; FINAL DELIVERABLES | All |
| 13 | 28 may | 4 june | FINAL REPORT, PRESENTATION & VIDEO | All |
| 14 | 4 june | 11 june | FINAL REPORT, PRESENTATION & VIDEO | All |
| 15 | 11 june | 18 june | FINAL REPORT, PRESENTATION & VIDEO ; FINAL DELIVERABLES | All |
Lastly, the visual dependencies and duration of these tasks are illustrated in the Gantt Chart (see Figure 4).

3.10. Sprint Outcomes
Sprints 1 & 2 were not managed in Jira and there were no specific tasks to be done. However, the idea of the project had been forming before Sprint 3 and some outcomes were achieved such as:
- Black Box Diagram V1
- Structural Drawings V1
- Selection of materials and components V1
- Inicial sketches of our project idea
3.10.1 Sprint 3 Outcome
As illustrated in Figure 5, the Sprint 3 Burndown Chart captures our very first agile tracking cycle and the initial progress trends of the team.

In Sprint 3 we consolidated both the technical foundation of the project and the supporting documentation. The team completed all planned issues in Jira, with no carry‑over work. Key outcomes included updated structural drawings and schematics (V2), the cardboard model, and a refined selection of materials and components. We also advanced the digital side with Figma designs for the message application and progressed written deliverables such as the background/related work and eco‑efficiency measures. Routine work like daily meetings, the sprint retrospective, and logbook updates was completed, ensuring the project stayed aligned and well documented.
- Why the velocity report/burndown looks like this: Being our first sprint managed in Jira, the chart reflects initial planning chaos. The scope (red line) suddenly spiked mid-sprint because we committed the mistake of scope creep, adding major deliverables like the Cardboard Model and V2 designs on the fly instead of locking the backlog on day one.
- The Good and the Bad (Why we didn't complete 100%): The bad habit was a prolonged flatline at zero due to last-minute status changes; the team was working in the lab but forgot to update Jira progressively. On the good side, a powerful final surge allowed us to bulk-update and close the core technical foundations just before the deadline.
- Retrospective & Group Dynamic: We realized that our initial estimations were pure guesswork due to a lack of historical data. For the next cycles, we officially banned adding any new tasks once a sprint is active and established a strict rule for real-time status updates.
3.10.2 Sprint 4 Outcome
To analyze our development velocity during the middle phase of development, Figure 6 outlines the task execution line and workload behavior for Sprint 4.

In Sprint 4 we advanced both the written deliverables and the technical foundations of the CONNECT and share system. The team completed the core report chapters (Introduction, Background & Related Work, Marketing Plan, Eco‑Efficiency Measures, Ethical & Deontological Concerns) and updated the project wiki start page, ensuring the documentation is coherent and aligned with the project vision. On the technical side, we produced Structural Drawings V3 with measurements, Detailed Schematics V3, a general software flow chart, and updated the list of materials and components, while also finalizing the clickable web app prototype and the design system/brand guidelines. Routine process tasks such as daily meetings, the sprint retrospective, and logbook updates were completed, keeping communication and traceability strong. Some higher‑effort items like Chapter 3 – Project Management, Chapter 7 – Project Developments, and the Interim Presentation remained in progress and will be continued in Sprint 5.
- Why the velocity report/burndown looks like this: In Sprint 4, we grew overly ambitious and massive overestimation took place, setting a giant baseline of over 110 Story Points. The scope stayed flat, but our completed work (green line) shows that we finished barely 50% of what we promised, revealing a clear bottleneck in our velocity.
- The Good and the Bad (Why we didn't complete 100%): The bad part was a severe technical roadblock: our hardware team hit a logic level nightmare with the WS2813 LED strips and the ESP32 (3.3V vs 5V logic), which paralyzed firmware progression. The good part was that we successfully advanced massive blocks of written documentation and finalized the clickable web app prototype layout.
- Retrospective & Group Dynamic: The team learned a harsh lesson about technical dependencies. We agreed that high-risk hardware integrations must be prioritized early in the sprint and assigned fewer story points to general documentation to balance the workload.
3.10.3 Sprint 5 Outcome
The tracking data exported from Jira in Figure 7 displays the evolution of our remaining effort during Sprint 5, highlighting a noticeable stagnation phase.

- Why the velocity report/burndown looks like this: The burndown line shows a flat zero progress for the first full week of the cycle, followed by mid-sprint scope changes where the red line expanded. We suffered a noticeable completion gap, leaving nearly a third of the story points completely uncompleted at the deadline.
- The Good and the Bad (Why we didn't complete 100%): The bad side was a total drop in group momentum due to the Easter holidays. The festive break and travel schedules completely destabilized our operational cadence. On the good side, our high resilience allowed the team to reunite immediately after the break to front-load effort, pushing structural drawings (V3) and detailed schematics over the line.
- Retrospective & Group Dynamic: We recognized that statutory holidays can completely break the project flow if tasks are not scheduled around them. We determined that for future holiday periods, we must front-load deliverables or officially downscale the sprint capacity beforehand to align with real availability.
3.10.4 Sprint 6 Outcome
In Figure 8, the generated sprint report uncovers a pronounced flatline pattern that dominated the majority of our Sprint 6 tracking timeline.

- Why the velocity report/burndown looks like this: This chart shows an extreme case of “Student Syndrome” flatlining. The green line stays flat at zero points for almost the entire duration of the sprint, showing a single sharp vertical drop on the absolute final day to clear less than half of the total commitment.
- The Good and the Bad (Why we didn't complete 100%): The bad element was a severe communication breakdown regarding task ownership, leading to multiple team members waiting for others to finish pre-requisite components. The good aspect was that the work completed, although late, successfully cleared critical low-power firmware states and standby current optimizations.
- Retrospective & Group Dynamic: We realized that unassigned tasks in the backlog lead to total operational paralysis. The group enforced a strict retrospective rule: every single active Jira task must have a clear individual owner and explicit sub-tasks before a sprint is cleared to launch.
3.10.5 Sprint 7 Outcome
Figure 9 presents the real-world metrics from our seventh sprint iteration, demonstrating how technical challenges affected our daily work logging.

- Why the velocity report/burndown looks like this: The chart displays an erratic scope line at the start and another flatline spanning the entire middle week. While we managed to increase our overall velocity compared to past weeks, we still faced a major deficit at the close of the cycle.
- The Good and the Bad (Why we didn't complete 100%): The bad habit was our ongoing resistance to daily logging, keeping task updates confined to the weekend. On the positive side, the hardware team successfully mitigated floating ADC noise on the Velostat sensor by validating the new mechanical housing, which unblocked the core input conditioning firmware.
- Retrospective & Group Dynamic: We resolved to schedule mandatory, physical co-working sessions instead of relying on individual remote tracking.
3.10.6 Sprint 8 Outcome
The graphic evaluation provided in Figure 10 highlights the operational changes made during Sprint 8, where a downscaled scope strategy was implemented.

- Why the velocity report/burndown looks like this: In Sprint 8, we significantly lowered our target capacity to roughly 32 Story Points. The burndown line looks slightly better, showing an early step-down drop before flatlining in the middle and concluding with a small final delivery gap.
- The Good and the Bad (Why we didn't complete 100%): The good part is that lowering our scope allowed the team to breathe and focus on quality, achieving a much higher completion percentage. The bad part was that a critical dependency on the cork housing assembly delayed our physical integration, preventing a perfect 100% completion rate.
- Retrospective & Group Dynamic: This sprint proved that downscaling our capacity based on historical reality was the correct management choice. We decided to keep our sprint targets realistic rather than over-promising unachievable milestones to the supervisors.
3.10.7 Sprint 9 Outcome
As detailed in Figure 11, the sprint history reveals a more progressive and steady downward burn of tasks, indicating a maturation of team logging discipline.

- Why the velocity report/burndown looks like this: This chart reflects an improved, more progressive downward trend in the green line during the mid-sprint phase, breaking our traditional flatline habit, though a sudden late scope increase slightly altered the final tracking margin.
- The Good and the Bad (Why we didn't complete 100%): The good habit was that the team finally began updating Jira tasks mid-week, reflecting true daily laboratory efforts.
- Retrospective & Group Dynamic: Our group velocity finally started to show predictable patterns. The retrospective focus centered on padding out our software testing windows, acknowledging that external API integrations always introduce unpredictable delays.
3.10.8 Sprint 10 Outcome
Figure 12 details the workload distribution and steep final steps that occurred during the closing phase of Sprint 10 as assembly deadlines neared.

- Why the velocity report/burndown looks like this: This burndown shows a very slow start with a sudden, massive vertical drop on the absolute last day. The scope line was modified with late additions towards the end of the timeline, pushing our target limits.
- The Good and the Bad (Why we didn't complete 100%): The bad side was a return to bulk-updating tasks at the last minute due to the rush of preparing final project deliverables.
- Retrospective & Group Dynamic: With the final presentations approaching, group dynamics shifted into high-pressure execution mode. We learned that while last-minute rushes deliver results, they compromise our tracking accuracy, highlighting the need for better stress distribution across the weeks.
3.10.9 Sprint 11 Outcome
The final metrics dashboard visualized in Figure 13 displays our optimal burndown alignment, matching our most efficient development cycle.

- Why the velocity report/burndown looks like this: Sprint 11 shows a highly progressive step-like burndown chart, displaying clear, active drops across the middle days of the cycle. Although a late scope expansion was introduced, the green line closely followed the ideal directive slope.
- The Good and the Bad (Why we didn't complete 100%): The great success was that we achieved our highest task completion rate of the semester, successfully stabilizing the CAN Bus network and locking down the QR web application routing. The only negative aspect was that minor presentation formatting details had to be pushed to Sprint 12.
- Retrospective & Group Dynamic: This sprint proved that breaking down tasks into granular pieces (under 5 story points) yields excellent tracking metrics and constant progress. The group dynamic reached full agile maturity just in time for the final project closeout.
3.10.10 Sprint 12 Outcome
Figure 14 presents the tracking metrics and burndown trend from Sprint 12, highlighting the critical challenges faced by the team during the late-stage integration phase.

- Why the velocity report/burndown looks like this: The chart shows a severe execution gap, where we completed less than 50% of our planned tasks (reaching only around 17 Story Points out of 38). Furthermore, the scope (red line) shows unexpected increases both at the very beginning and at the absolute deadline, proving that we suffered from late-stage scope creep by adding unplanned emergency tasks on the fly.
- The Good and the Bad (Why we didn't complete 100%): When combining the hardware and software systems, we discovered critical bugs, communication lags, and power instability that flatlined our progress (green line) between June 4th and June 8th. The good side was that once these technical bottlenecks were unblocked, the team achieved an acceleration during the final days to rescue the core data routing features.
- Retrospective & Group Dynamic: We realized that leaving complex integrations for the next sprint was a high-risk management mistake. In our retrospective, we decided that the final cycle (Sprint 13) must be completely locked with zero new features, dedicating 100% of our remaining capacity to fixing small things and perfecting the final presentation.
3.11. Sprint Evaluations
Sprint evaluations and retrospectives are fundamental to the team’s Agile workflow, allowing for continuous process improvement. Starting from Sprint 3, the team implemented formal retrospective sessions to identify bottlenecks and refine internal methodologies.
3.11.1. Sprint 3 Retrospective
In this sprint, the focus was on establishing the technical foundation. The retrospective revealed significant gaps in task granularity and time management.
Retrospective Summary:
- Positive (+): Effective feedback loops with professors and proactive note-taking during presentations.
- Negative (-): Vague backlog items, inconsistent Jira updates, and poor workload distribution.
- Action Plan: The team committed to breaking down tasks into sub-tasks (max 4h each) and ensuring Jira is updated daily.
3.11.2. Sprint 4 Retrospective
Following the action plan from the previous sprint, Sprint 4 showed a marked improvement in organization and team morale.
Retrospective Summary:
- Positive (+): High motivation, excellent mutual support, and a much more balanced task distribution.
- Negative (-): No major process blockers identified; the workflow reached a stable state.
- Action Plan: Focus on maintaining the current communication frequency and standardizing the documentation style for the upcoming deliverables.
3.11.3. Sprint 5 Retrospective
Sprint 5 centered on the team's first formal presentation. The retrospective highlighted strong collaboration and timely delivery, but identified gaps in presentation rehearsal and logistics.
Retrospective Summary:
- Positive (+): Strong mutual support, high motivation, timely task completion, and a well-received presentation.
- Negative (-): Last-minute changes to slides and script, lack of in-person group rehearsal, and unclear stage roles and transitions.
- Action Plan: The team agreed to freeze presentation content 24 hours before the deadline, schedule a mandatory in-person dry run, and explicitly assign stage positions and slide control responsibilities during planning.
3.11.4. Sprint 6 Retrospective
Sprint 6 focused on production of key deliverables, including the promotional video, 3D model, and marketing materials. The retrospective reflected strong output but flagged recurring carry-over as an area for improvement.
Retrospective Summary:
- Positive (+): Clear task ownership, consistent progress on the web app, and successful completion of major deliverables including the video and 3D model.
- Negative (-): Some tasks carried over across multiple sprints, indicating insufficient task breakdown during planning.
- Action Plan: The team committed to decomposing tasks into smaller, more manageable steps from the outset of each sprint to reduce carry-over.
3.11.5. Sprint 7 Retrospective
Sprint 7 saw the completion of several key deliverables and continued web app progress. The retrospective identified procrastination as the main obstacle to a smoother workflow.
Retrospective Summary:
- Positive (+): Clear task division, steady web app progress, and successful completion of the provider list, materials list, video, and 3D model.
- Negative (-): Procrastination led to tasks being completed later in the sprint than planned.
- Action Plan: The team committed to starting tasks earlier in each sprint cycle to maintain a more consistent workload distribution.
3.11.6. Sprint 8 Retrospective
Sprint 8 we had strong team cohesion and worked efficient with tasks. The retrospective identified no significant areas for improvement.
Retrospective Summary:
- Positive (+): Strong collaboration and communication across the team, clear task ownership, and well-balanced workload distribution.
- Negative (-): No process issues identified.
- Action Plan: The team agreed to maintain the current working dynamic and communication standards going forward.
3.11.7. Sprint 9 Retrospective
Sprint 9 delivered comunication/visual material that received good feedback and continued web app progress, but exposed workflow gaps tied to component delays and tasks that carried over several sprints.
Retrospective Summary:
- Positive (+): Positive supervisor feedback, completion of the leaflet, poster, and visual materials, and continued steady progress on the web app.
- Negative (-): Several tasks carried over across multiple sprints, and prototype work was blocked pending component delivery.
- Action Plan: The team committed to improving workflow oversight to better anticipate blockers and prevent task accumulation.
3.11.8. Sprint 10 Retrospective
Sprint 10 was a stable sprint with most tasks completed as expected. The team acknowledged the need to pick up the pace as the project deadline draws closer.
Retrospective Summary:
- Positive (+): Tasks were mostly completed as planned.
- Negative (-): The team recognized the need to work more intensively in the final sprints.
- Action Plan: The team committed to increasing the work pace to meet final deadlines.
3.11.9. Sprint 11 Retrospective
Sprint 11 featured a successful marketing pre-presentation and good team communication. Carrying over tasks remained as an ongoing challenge.
Retrospective Summary:
- Positive (+): Successful marketing pre-presentation and strong team communication.
- Negative (-): Some tasks carried over across multiple sprints.
- Action Plan: The team committed to breaking tasks into smaller steps from the start of each sprint so they don’t carry over several sprints.
3.12. Summary
This chapter detailed the management strategies used to organize and track the project's progress. We established the core foundations for scope, time, and cost, while also setting up protocols for quality, risk, and procurement. Managing communications and stakeholders was also key to keeping the workflow consistent and transparent.
These management pillars are put into practice through a cycle of continuous planning and execution. The Sprint outcomes and evaluations documented here reflect our ongoing effort to refine the workflow and hit project milestones. With the management structure in place, the focus now shifts to the Marketing Plan to define the project's market strategy and value proposition.